Brain Iron on MRI Predicts Cognitive Impairment, Decline
Released: September 09, 2025
- RSNA Media Relations
1-630-590-7762
media@rsna.org - Linda Brooks
1-630-590-7738
lbrooks@rsna.org
OAK BROOK, Ill. — A special MRI technique that detects iron levels in different regions of the brain can predict the onset of mild cognitive impairment and cognitive decline in cognitively unimpaired older adults, potentially creating a pathway to earlier interventions, according to a study published today in Radiology, a journal of the Radiological Society of North America (RSNA).
As the leading cause of dementia worldwide, Alzheimer's disease is a growing public health crisis. The disease is characterized by the accumulation of abnormal proteins in the brain called amyloid beta and tau, which manifest years prior to the appearance of clinical symptoms and can be detected with positron emission tomography (PET) scans. Treatments targeting these proteins are only modestly effective, indicating that other factors may contribute to cognitive impairment.
Elevated levels of iron in the brain are one factor under investigation in recent years. Iron overload in the brain is known to drive neurodegeneration by inducing oxidative stress (an imbalance between two different types of molecules in your body: free radicals and antioxidants), exacerbating amyloid toxicity, disrupting tau protein function and promoting nerve cell death.

Brain iron can be measured noninvasively through a special MRI technique called quantitative susceptibility mapping (QSM).
"QSM is an advanced MRI technique developed over the last decade to measure tissue magnetic susceptibility with good precision," said the study's senior author Xu Li, Ph.D., associate professor of radiology at Johns Hopkins University and research associate at the F.M. Kirby Research Center for Functional Brain Imaging at the Kennedy Krieger Institute in Baltimore, Maryland. "QSM can detect small differences in iron levels across different brain regions, providing a reliable and non-invasive way to map and quantify iron in patients, which is not possible with conventional MR approaches."
Dr. Li and colleagues studied QSM MRI on 158 cognitively unimpaired participants drawn from the Johns Hopkins BIOCARD Study, a research project focused on the early stages of Alzheimer's disease and related disorders. PET data was available for 110 of the participants.
The researchers acquired baseline QSM MRI data on the participants and then followed them for up to seven and a half years. They found that higher baseline magnetic susceptibility on MRI in the entorhinal cortex and putamen—two brain regions important to memory and other cognitive functions—was associated with a higher risk of mild cognitive impairment, a transitional stage preceding Alzheimer's disease-related dementia.
"Using QSM, we found higher brain iron in some memory related regions that are linked to a higher risk of developing cognitive impairment and faster cognitive decline," Dr. Li said. "This risk is even higher when the participants have higher levels of amyloid pathologies."
Even though amyloid burden and tissue susceptibility in the entorhinal cortex and putamen were independently associated with progression to mild cognitive impairment, they appeared to have synergistic effects, Dr. Li said, accelerating global cognitive decline over time.
If confirmed in larger studies with more diverse patient populations, the findings point to a role for QSM MRI in the workup of patients at risk of dementia.
"We can use this kind of tool to help identify patients at higher risk of developing Alzheimer's disease and potentially guide early interventions as new treatments become available," Dr. Li said. "Also, besides serving as a biomarker, brain iron may become a future therapeutic target."
Going forward, the researchers hope to gain a better understanding of how brain iron contributes to Alzheimer's disease, including its interaction with other Alzheimer's disease-related pathologies like amyloid and tau proteins. On the therapeutic side, clinical trials could test iron-targeted therapies.
"At the same time, we hope to make the QSM technology more standardized, faster and more widely accessible in clinical practice," Dr. Li said.
"Susceptibility MRI Helps Predicts Mild Cognitive Impairment Onset and Cognitive Decline in Cognitively Unimpaired Older Adults." Collaborating with Dr. Li were Lin Chen, Ph.D., Anja Soldan, M.A., Ph.D., Andreia Faria, M.D., Ph.D., Marilyn Albert, Ph.D., and Peter C. M. van Zijl, Ph.D., for the BIOCARD Study Team.
Radiology is edited by co-interim editors Vicky Goh, M.B.B.Ch., King's College London, U.K., and Kathryn Fowler, M.D., University of California San Diego, California, and owned and published by the Radiological Society of North America, Inc. (https://pubs.rsna.org/journal/radiology)
RSNA is an association of radiologists, radiation oncologists, medical physicists and related scientists promoting excellence in patient care and health care delivery through education, research and technologic innovation. The Society is based in Oak Brook, Illinois. (RSNA.org)
For patient-friendly information on brain MRI, visit RadiologyInfo.org.
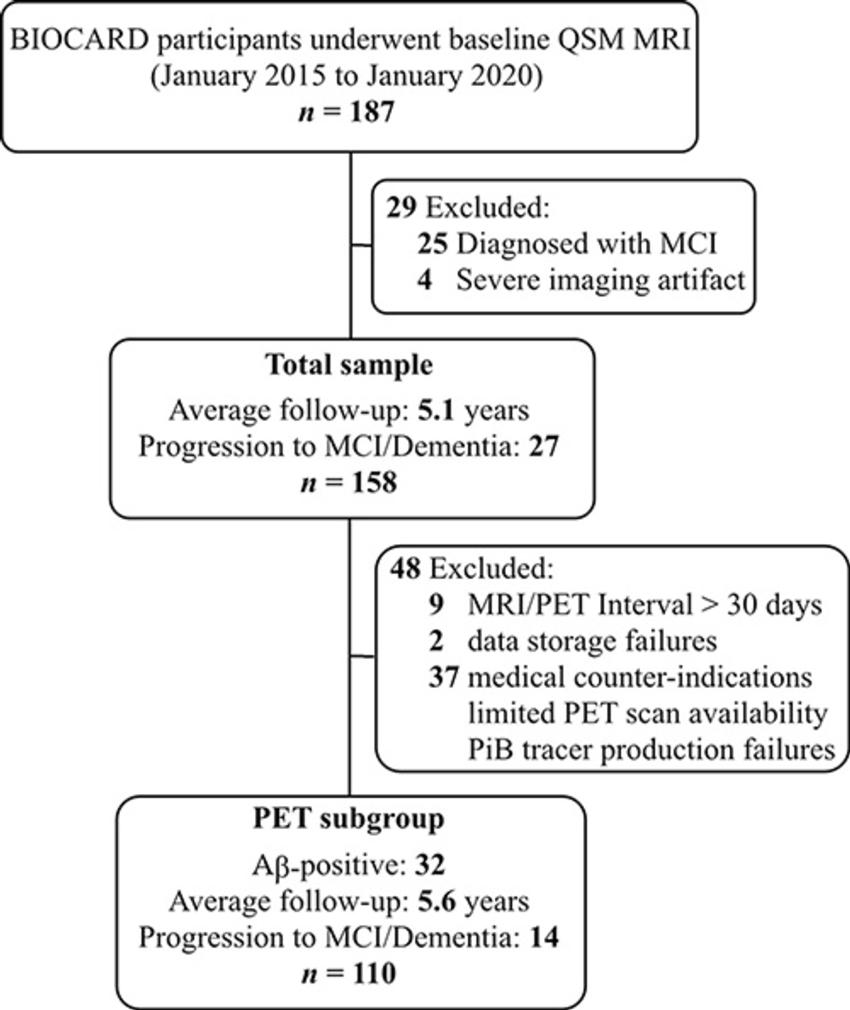
Figure 1. Participant inclusion and exclusion flowchart for the total sample and the PET subgroup. Aβ = amyloid β, AD = Alzheimer disease, BIOCARD = Biomarkers for Older Controls at Risk for Dementia, MCI = mild cognitive impairment, PiB = Pittsburgh compound B, QSM = quantitative susceptibility mapping.
High-res (TIF) version
(Right-click and Save As)
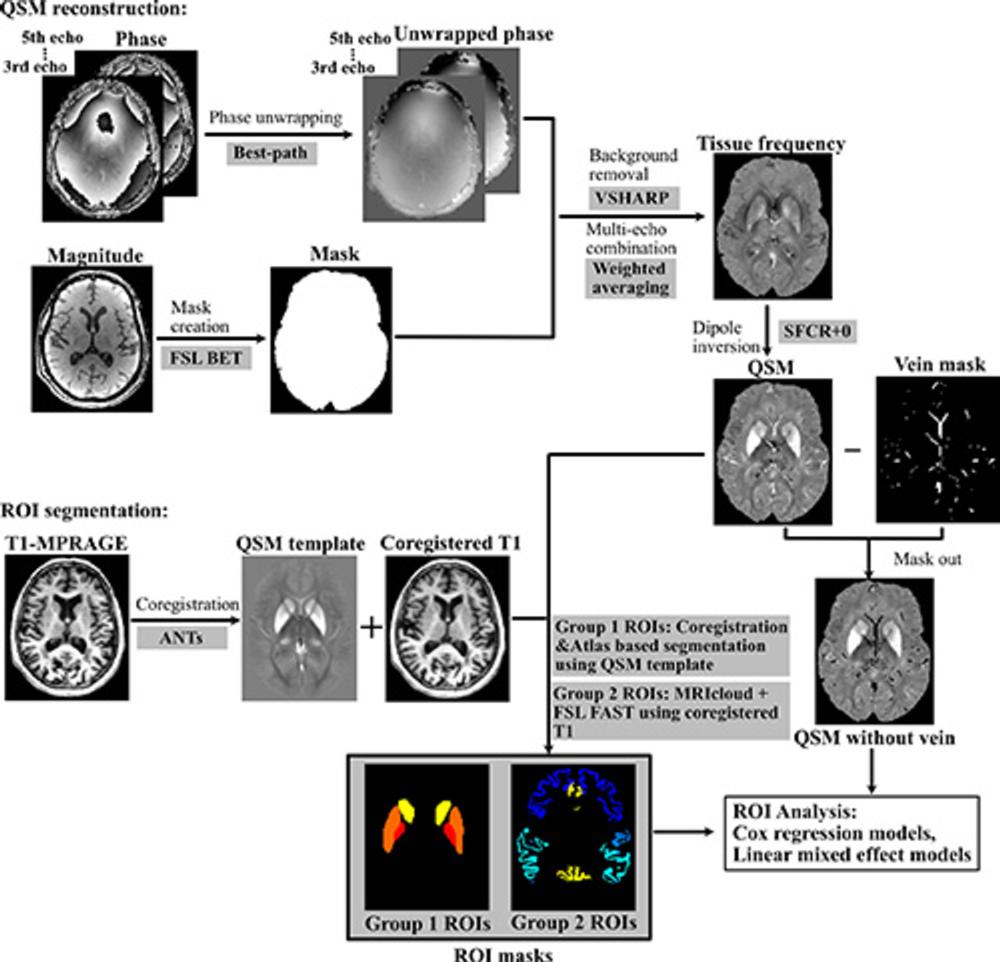
Figure 2. Processing pipeline for quantitative susceptibility mapping (QSM) reconstruction and region-of-interest (ROI) segmentation MRICloud is cloud-based medical image processing software (mricloud.org). ANT = advanced normalization tool, BET = brain extraction tool, FAST = functional MRI of the brain automated segmentation tool, FSL = functional MRI of the brain software library, MPRAGE = magnetization-prepared rapid gradient-echo, SFCR+0 = structural feature–based collaborative reconstruction with auto referencing to central cerebrospinal fluid, VSHARP = variable radius sophisticated harmonic artifact reduction for phase data.
High-res (TIF) version
(Right-click and Save As)
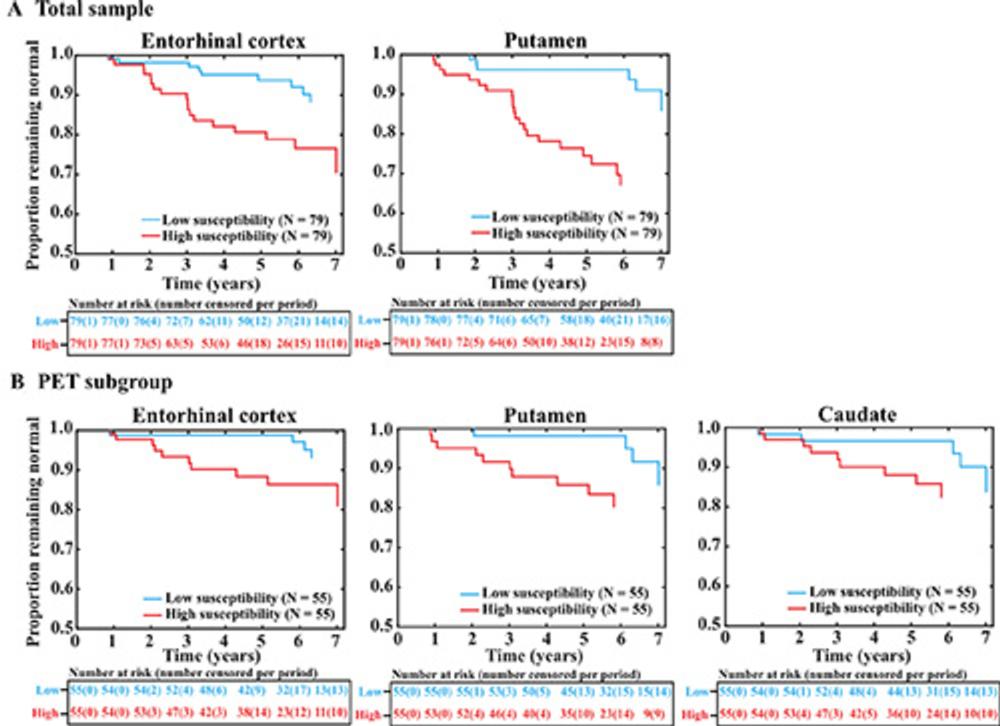
Figure 3. Survival plots show the associations of regional susceptibility with time to mild cognitive impairment diagnosis. (A) The total sample in the entorhinal cortex and putamen. (B) The PET subgroup in the entorhinal cortex, putamen, and caudate nucleus. The survival (Kaplan-Meier) plots of the results of Cox regression show the proportion of participants who remained cognitively normal over time as a function of their baseline regional brain tissue susceptibility, measured by quantitative susceptibility mapping. For display purposes, median values were used to dichotomize participants into low- and high-susceptibility groups.
High-res (TIF) version
(Right-click and Save As)
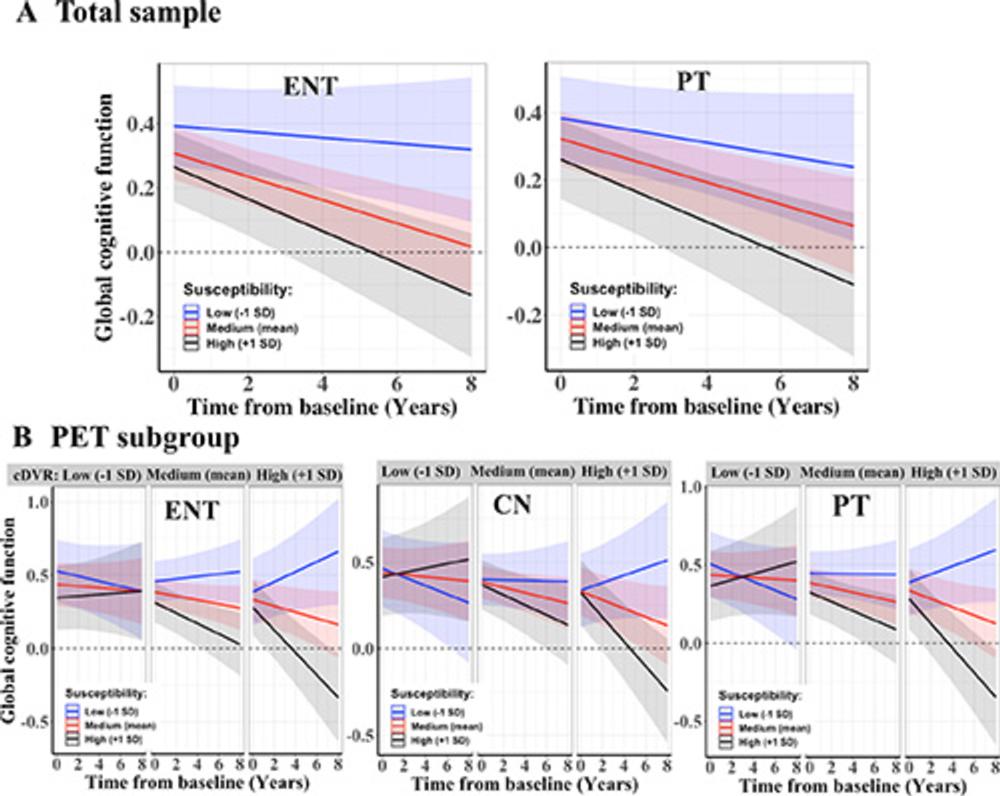
Figure 4. Plots show associations of regional susceptibility with global cognitive performance decline. (A) Predicted values with 95% CI bands from linear mixed-effects models assessing longitudinal global cognitive composite scores over time as a function of baseline susceptibility values that are at (red) or 1 SD above (black) or below (blue) the mean for the total sample in the entorhinal cortex (ENT) and putamen (PT). (B) Predicated global cognitive composite scores as a function of baseline susceptibility values and baseline cortical distribution volume ratio (cDVR) values (both as continuous variables) that are at or 1 SD above or below the mean for the PET subgroup in the entorhinal cortex, caudate nucleus (CN), and putamen. Within each plot, the three subpanels indicate values at (middle) and 1 SD above (right side) and below (left side) the group mean for global cDVRs.
High-res (TIF) version
(Right-click and Save As)
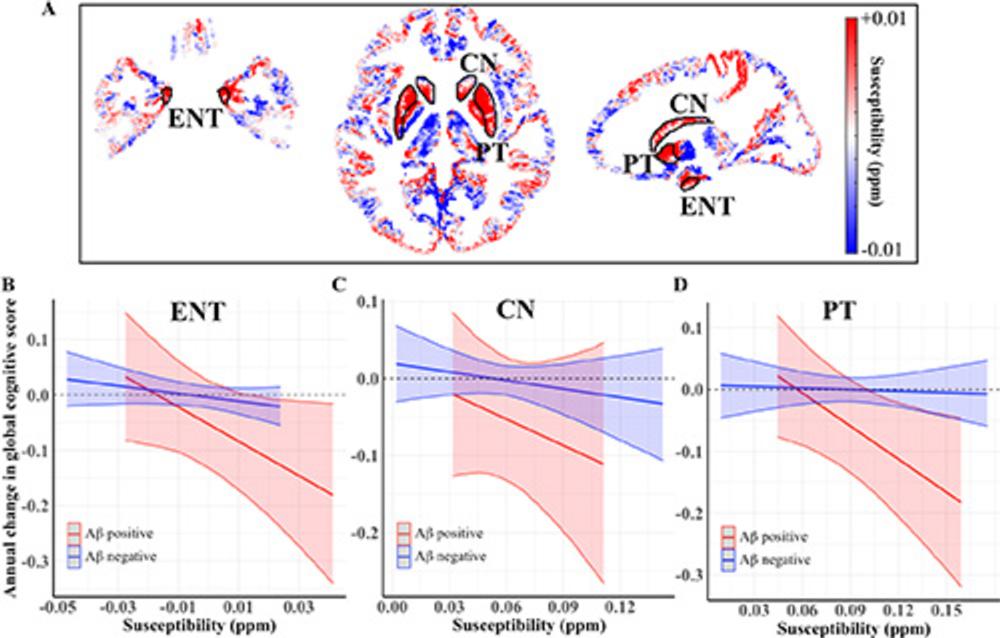
Figure 5. Relationships among regional susceptibility, amyloid-β (Aβ) load, and annual changes in global cognitive scores. (A) Quantitative susceptibility maps show difference in gray matter regions in the Montreal Neurological Institute space, comparing group averages of the participants who were positive for Aβ versus negative for Aβ. Plots show associations between the baseline susceptibility values in the (B) entorhinal cortex (ENT), (C) caudate nucleus (CN), and (D) putamen (PT), and annual changes in the global cognitive score in participants with negative (blue) versus positive (red) global amyloid-β load.
High-res (TIF) version
(Right-click and Save As)