RSNA AI Challenge Models Can Independently Interpret Mammograms
Released: August 12, 2025
- RSNA Media Relations
1-630-590-7762
media@rsna.org - Linda Brooks
1-630-590-7738
lbrooks@rsna.org
OAK BROOK, Ill. — Algorithms submitted for an AI Challenge hosted by the Radiological Society of North America (RSNA) have shown excellent performance for detecting breast cancers on mammography images, increasing screening sensitivity while maintaining low recall rates, according to a study published today in Radiology, the premier journal of the RSNA.
The RSNA Screening Mammography Breast Cancer Detection AI Challenge was a crowdsourced competition that took place in 2023, with more than 1,500 teams participating. The Radiology article details an analysis of the algorithms' performance, led by Yan Chen, Ph.D., a professor in cancer screening at the University of Nottingham in the United Kingdom.
"We were overwhelmed by the volume of contestants and the number of AI algorithms that were submitted as part of the Challenge," Prof. Chen said. "It's one of the most participated-in RSNA AI Challenges. We were also impressed by the performance of the algorithms given the relatively short window allowed for algorithm development and the requirement to source training data from open-sourced locations."

The goal of the Challenge was to source AI models that improve the automation of cancer detection in screening mammograms, helping radiologists work more efficiently, improving the quality and safety of patient care, and potentially reducing costs and unnecessary medical procedures.
RSNA invited participation from teams across the globe. Emory University in Atlanta, Georgia, and BreastScreen Victoria in Australia provided a training dataset of around 11,000 breast screening images, and Challenge participants could also source publicly available training data for their algorithms.
Prof. Chen's research team evaluated 1,537 working algorithms submitted to the Challenge, testing them on a set of 10,830 single-breast exams—completely separate from the training dataset—that were confirmed by pathology results as positive or negative for cancer.
Altogether, the algorithms yielded median rates of 98.7% specificity for confirming no cancer was present on mammography images, 27.6% sensitivity for positively identifying cancer, and a recall rate—the percentage of the cases that AI judged positive—of 1.7%. When the researchers combined the top 3 and top 10 performing algorithms, it boosted sensitivity to 60.7% and 67.8%, respectively.
"When ensembling the top performing entries, we were surprised that different AI algorithms were so complementary, identifying different cancers," Prof. Chen said. "The algorithms had thresholds that were optimized for positive predictive value and high specificity, so different cancer features on different images were triggering high scores differently for different algorithms."
According to the researchers, creating an ensemble of the 10 best-performing algorithms produced performance that is close to that of an average screening radiologist in Europe or Australia.
Individual algorithms showed significant differences in performance depending on factors such as the type of cancer, the manufacturer of the imaging equipment and the clinical site where the images were acquired. Overall, the algorithms had greater sensitivity for detecting invasive cancers than for noninvasive cancers.
Since many of the participants' AI models are open source, the results of the Challenge may contribute to the further improvement of both experimental and commercial AI tools for mammography, with the goal of improving breast cancer outcomes worldwide, Prof. Chen explained.
"By releasing the algorithms and a comprehensive imaging dataset to the public, participants provide valuable resources that can drive further research and enable the benchmarking that is required for the effective and safe integration of AI into clinical practice," she said.
The research team plans to conduct follow-up studies to benchmark the performance of the top Challenge algorithms against commercially available products using a larger and more diverse dataset.
"Additionally, we will investigate the effectiveness of smaller, more challenging test sets with robust human reader benchmarks—such as those developed by the PERFORMS scheme, a UK-based program for assessing and assuring the quality of radiologist performance as an approach for AI evaluation, and compare its utility to that of large-scale datasets," Prof. Chen said.
RSNA hosts an AI Challenge annually, with this year's competition seeking submissions for models that help detect and localize intracranial aneurysms.
"Performance of Algorithms Submitted in the 2023 RSNA Screening Mammography Breast Cancer Detection AI Challenge." Collaborating with Prof. Chen were George J. W. Partridge, B.Sc., Maryam Vazirabad, M.Sc., Robyn L. Ball, Ph.D., Hari M. Trivedi, M.D., Felipe Campos Kitamura, M.D., Ph.D., Helen M. L. Frazer, M.B.B.S., FRANZCR, M.Epi., Tara A. Retson, M.D., Ph.D., Luyan Yao, M.Sc., Iain T. Darker, Ph.D., Tatiana Kelil, M.D., John Mongan, M.D., Ph.D., Ritse M. Mann, M.D., and Linda Moy, M.D.
Radiology is edited by Linda Moy, M.D., New York University, New York, N.Y., and owned and published by the Radiological Society of North America, Inc. (https://pubs.rsna.org/journal/radiology)
RSNA is an association of radiologists, radiation oncologists, medical physicists and related scientists promoting excellence in patient care and health care delivery through education, research and technologic innovation. The Society is based in Oak Brook, Illinois. (RSNA.org)
For patient-friendly information on breast cancer screening, visit RadiologyInfo.org.
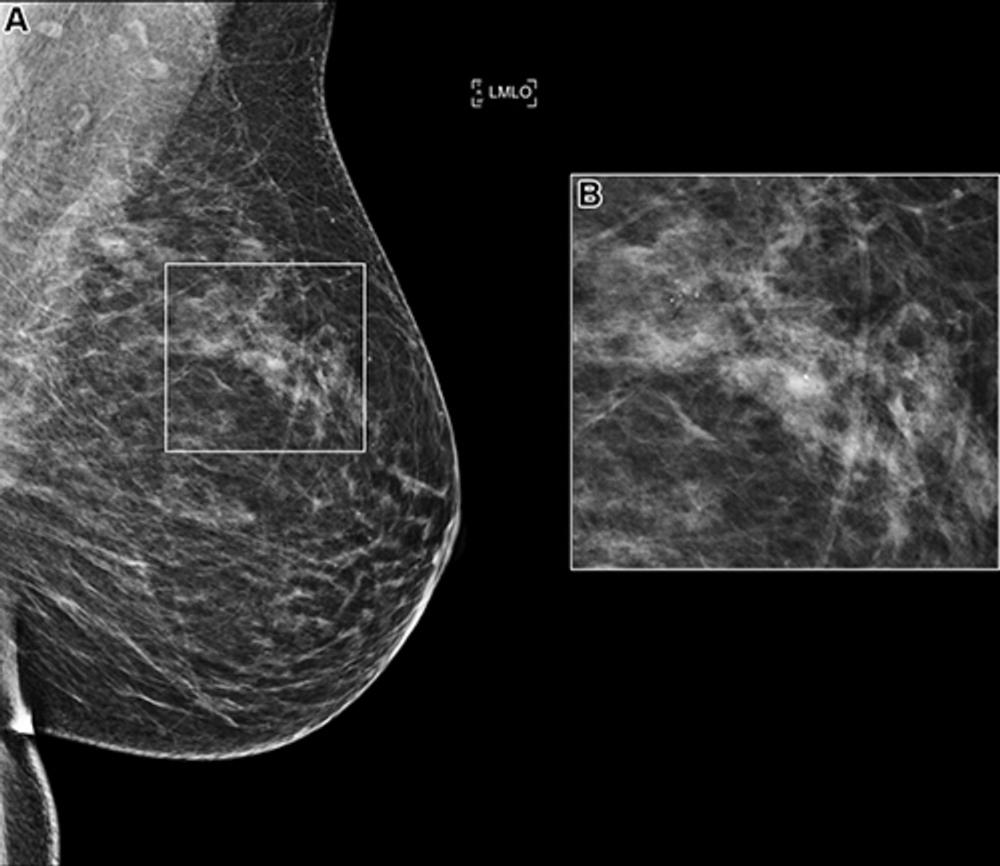
Figure 1. (A) Left mediolateral oblique (LMLO) mammogram in a 58-year-old woman with an area of microcalcification (box). (B) Magnified view (2.2×) of the box in A. This case was recalled by all of the top 10 artificial intelligence algorithms but was found to be benign at biopsy analysis.
High-res (TIF) version
(Right-click and Save As)
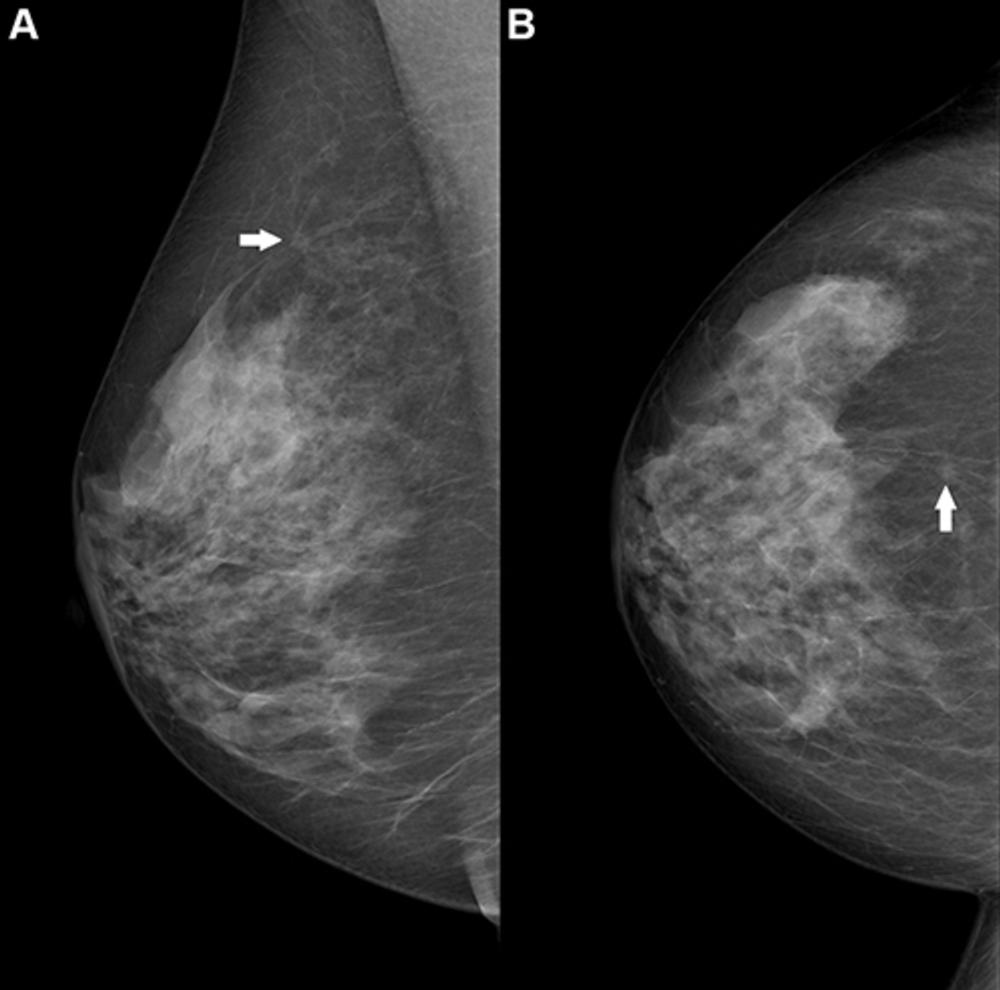
Figure 2. Right breast mammogram in a 69-year-old woman. There is a 6-mm spiculate mass in the 12 o’clock position (arrow), visible on both the (A) mediolateral oblique and (B) craniocaudal views. This case was not recalled by any of the top 10 artificial intelligence algorithms but was a biopsy-proven invasive carcinoma.
High-res (TIF) version
(Right-click and Save As)
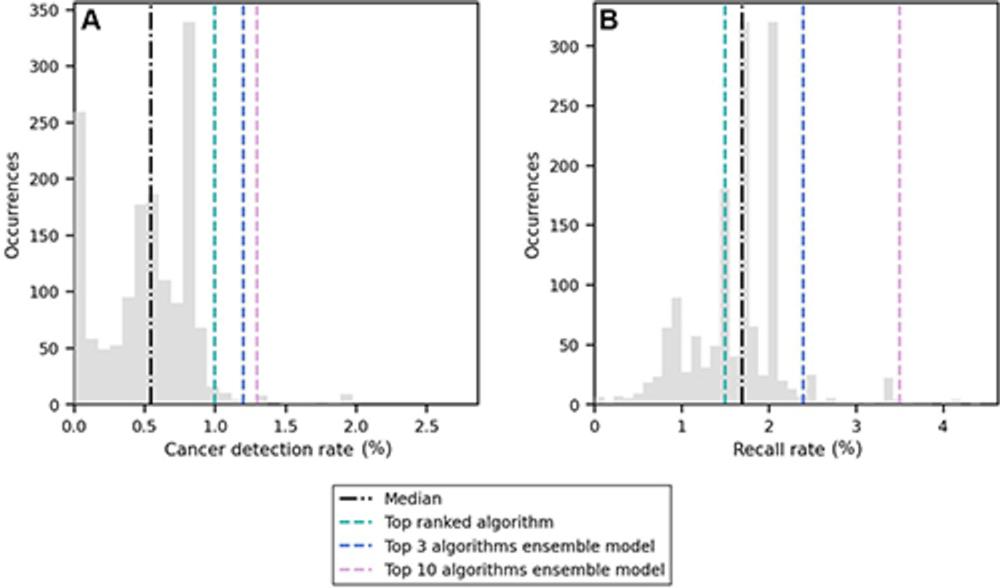
Figure 3. Distribution of (A) cancer detection rate and (B) recall rate among the 1,537 artificial intelligence algorithms evaluated in this study (gray bars). The median value is represented by the black line, and the scores of the top-ranked algorithm and the two ensemble models are shown with colored lines.
High-res (TIF) version
(Right-click and Save As)
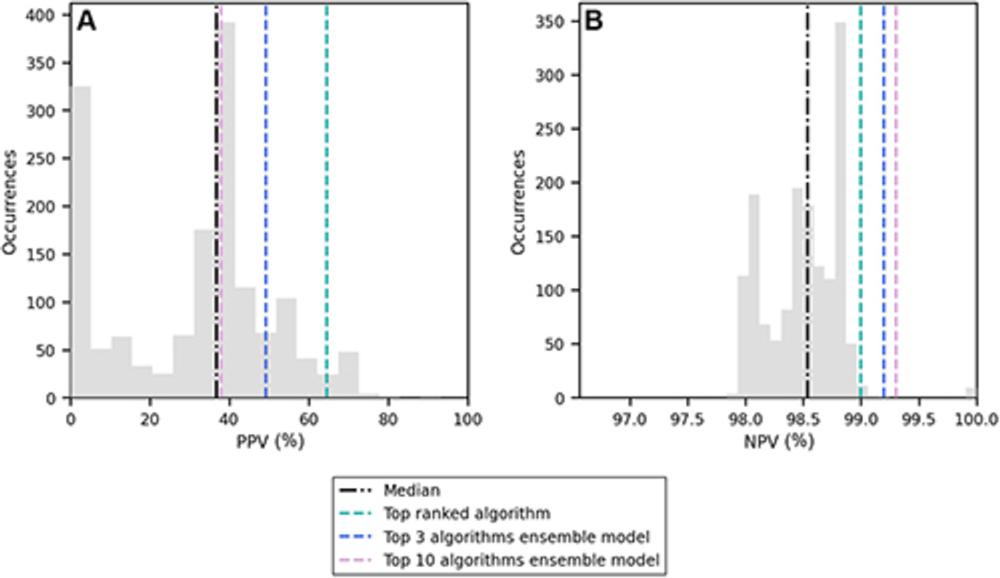
Figure 4. Distribution of (A) positive predictive value (PPV) and (B) negative predictive value (NPV) among the 1,537 artificial intelligence algorithms evaluated in this study (gray bars). The median value is represented by the black line, and the scores of the top-ranked algorithm and the two ensemble models are shown with colored lines.
High-res (TIF) version
(Right-click and Save As)
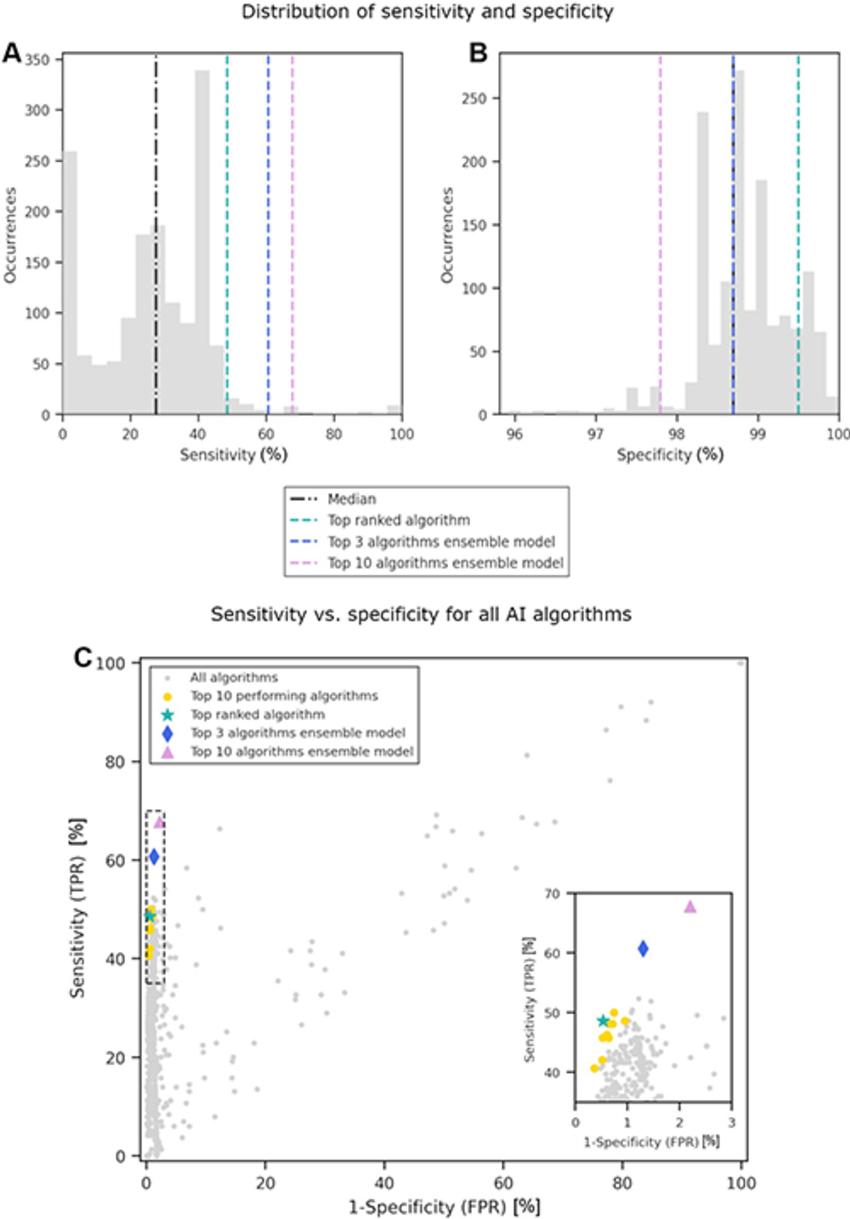
Figure 5. Distribution of (A) sensitivity and (B) specificity among the 1,537 artificial intelligence (AI) algorithms evaluated in this study (gray bars). The median value is represented by the black line, and the scores of the top-ranked algorithm and the two ensemble models are shown with colored lines. (C) Scatterplot of sensitivity versus specificity for each AI algorithm, where each gray dot represents a single AI algorithm. The inset on the right provides an expanded view of the area in the dashed box, so that the distribution of the top-performing algorithms can be seen at greater resolution. FPR = false-positive rate, TPR = true-positive rate.
High-res (TIF) version
(Right-click and Save As)
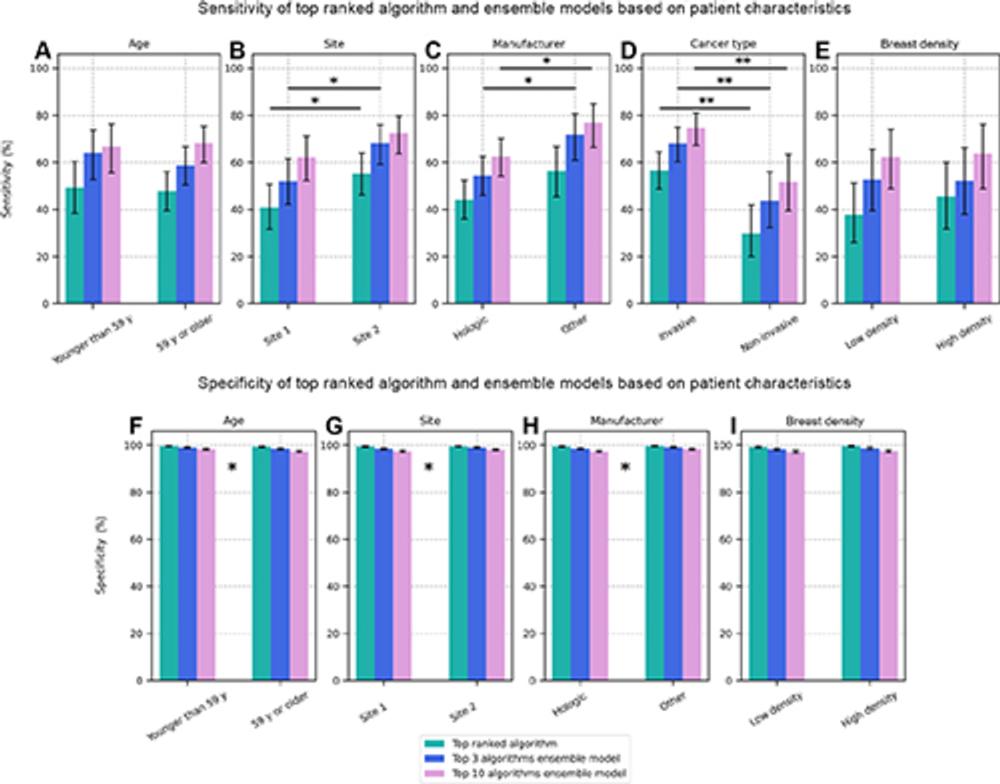
Figure 6. Bar plots showing the (A–E) sensitivity and (F–I) specificity of cancer detection by the top-performing artificial intelligence (AI) algorithm and the top 3 and top 10 ensemble models when the dataset was stratified as a function of different patient characteristics: (A, F) age, (B, G) site 1 (United States) versus site 2 (Australia), (C, H) equipment manufacturer, (D) invasive versus noninvasive cancer, and (E, I) low-density breasts (Breast Imaging Reporting and Data System A or B) versus high-density breasts (Breast Imaging Reporting and Data System C or D). Significant differences between subgroups are not indicated for specificity plots because of the relatively small differences in magnitude, but * indicates characteristics for which there was a significant difference between subgroups for one or more of the AI entities.
High-res (TIF) version
(Right-click and Save As)