AI Tool Accurately Detects Tumor Location on Breast MRI
Released: July 15, 2025
- RSNA Media Relations
1-630-590-7762
media@rsna.org - Linda Brooks
1-630-590-7738
lbrooks@rsna.org
OAK BROOK, Ill. — An AI model trained to detect abnormalities on breast MR images accurately depicted tumor locations and outperformed benchmark models when tested in three different groups, according to a study published today in Radiology, a journal of the Radiological Society of North America (RSNA).
"AI-assisted MRI could potentially detect cancers that humans wouldn't find otherwise," said the study's lead investigator Felipe Oviedo, Ph.D., a senior research analyst at Microsoft's AI for Good Lab.
Screening mammography is considered the standard of care in breast cancer screening. However, mammography is less effective in patients with dense breasts. Breast density is an independent risk factor for breast cancer and can mask a tumor. Physicians may order breast MRI to supplement screening mammography for women who have dense breasts and those at high risk for cancer.

"MRI is more sensitive than mammography," Dr. Oviedo said. "But it's also more expensive and has a higher false-positive rate."
To enhance the accuracy and efficiency of screening breast MRI, Dr. Oviedo's research team closely collaborated with clinical investigators in the Department of Radiology at the University of Washington to develop an explainable AI anomaly detection model. Anomaly detection models distinguish between normal and abnormal data, flagging the anomalies, or abnormalities, for further investigation.
"Previously developed models were trained on data of which 50% were cancer cases and 50% were normal cases, which is a very unrealistic distribution," Dr. Oviedo said. "Those models haven't been rigorously evaluated in low-prevalence cancer or screening populations (where 2% of all cases or less are cancer), and they also lack interpretability, both of which are essential for clinical adoption."
To address these limitations, the researchers trained their model using data from nearly 10,000 consecutive contrast-enhanced breast MRI exams performed at the University of Washington between 2005 and 2022. Patients were predominately white (greater than 80%), and 42.9% had heterogeneously dense breasts, while 11.6% had extremely dense breasts.
"Unlike traditional binary classification models, our anomaly detection model learned a robust representation of benign cases to better identify abnormal malignancies, even if they are underrepresented in the training data," Dr. Oviedo said. "Since malignancies can occur in multiple ways and are scarce in similar datasets, the type of anomaly detection model proposed in the study is a promising solution."
In addition to providing an estimated anomaly score, the detection model produces a spatially resolved heatmap for an MR image. This heatmap highlights in color the regions in the image that the model believes to be abnormal. The abnormal regions identified by the model matched areas of biopsy-proven malignancy annotated by a radiologist, largely surpassing the performance of benchmark models.
The model was tested on internal and external datasets. The internal dataset consisted of MRI exams performed on 171 women (mean age 48.8) for screening (71.9%; 31 cancers confirmed on subsequent biopsy) or pre-operative evaluation for a known cancer (28.1%; 50 cancers confirmed by biopsy). The external, publicly available, multicenter dataset included pre-treatment breast MRI exams of 221 women with invasive breast cancer.
The anomaly detection model accurately depicted tumor location and outperformed benchmark models in grouped cross-validation, internal and external test datasets, and in both balanced (high prevalence of cancer) and imbalanced (low cancer prevalence) detection tasks.
If integrated into radiology workflows, Dr. Oviedo said the anomaly detection model could potentially exclude normal scans for triage purposes and improve reading efficiency.
"Our model provides an understandable, pixel-level explanation of what's abnormal in a breast," he said. "These anomaly heatmaps could highlight areas of potential concern, allowing radiologists to focus on those exams that are more likely to be cancer."
Before clinical application, he said the model needs to be evaluated in larger datasets and prospective studies to assess its potential for enhancing radiologists' workflow.
"Cancer Detection in Breast MRI Screening via Explainable AI Anomaly Detection." Collaborating with Dr. Oviedo were Anum S. Kazerouni, Ph.D., Philipp Liznerski, Ph.D., Yixi Xu, Ph.D., Michael Hirano, M.S., Robert A. Vandermeulen, Ph.D., Marius Kloft, Ph.D., Elyse Blum, M.D., Ph.D., Adam M. Alessio, Ph.D., Christopher I. Li, M.D., Ph.D., William B. Weeks, M.D., Ph.D., M.B.A., Rahul Dodhia, Ph.D., Juan M. Lavista Ferres, Ph.D., Habib Rahbar, M.D., and Savannah C. Partridge, Ph.D.
Radiology is edited by Linda Moy, M.D., New York University, New York, N.Y., and owned and published by the Radiological Society of North America, Inc. (https://pubs.rsna.org/journal/radiology)
RSNA is an association of radiologists, radiation oncologists, medical physicists and related scientists promoting excellence in patient care and health care delivery through education, research and technologic innovation. The Society is based in Oak Brook, Illinois. (RSNA.org)
For patient-friendly information on breast MRI, visit RadiologyInfo.org
.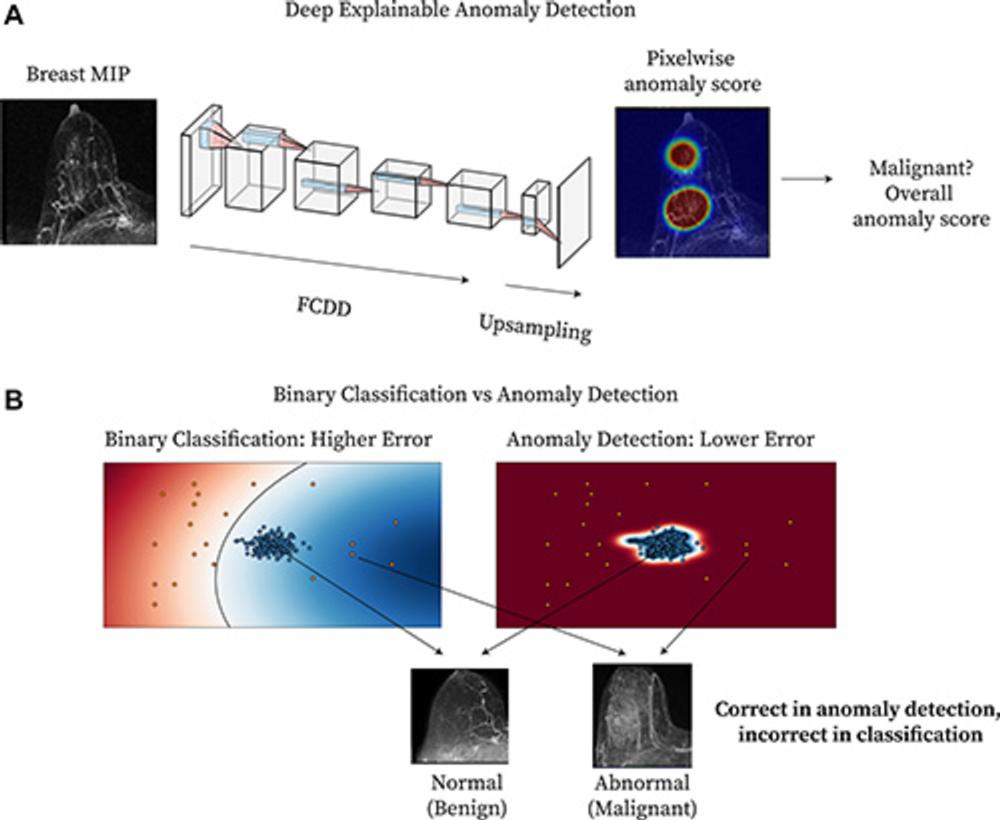
Figure 1. Method overview. (A) Diagram shows deep explainable anomaly detection at breast MRI. A maximum intensity projection (MIP) of a breast is passed to a fully convolutional neural network model trained using an explainable anomaly detection loss function (fully convolutional data description [FCDD]). (B) Diagram shows a conceptual comparison between binary classification and anomaly detection: Shading represents the learned normal (blue) and abnormal (red) feature spaces, and dots represent individual normal (blue) and abnormal (red) cases.
High-res (TIF) version
(Right-click and Save As)
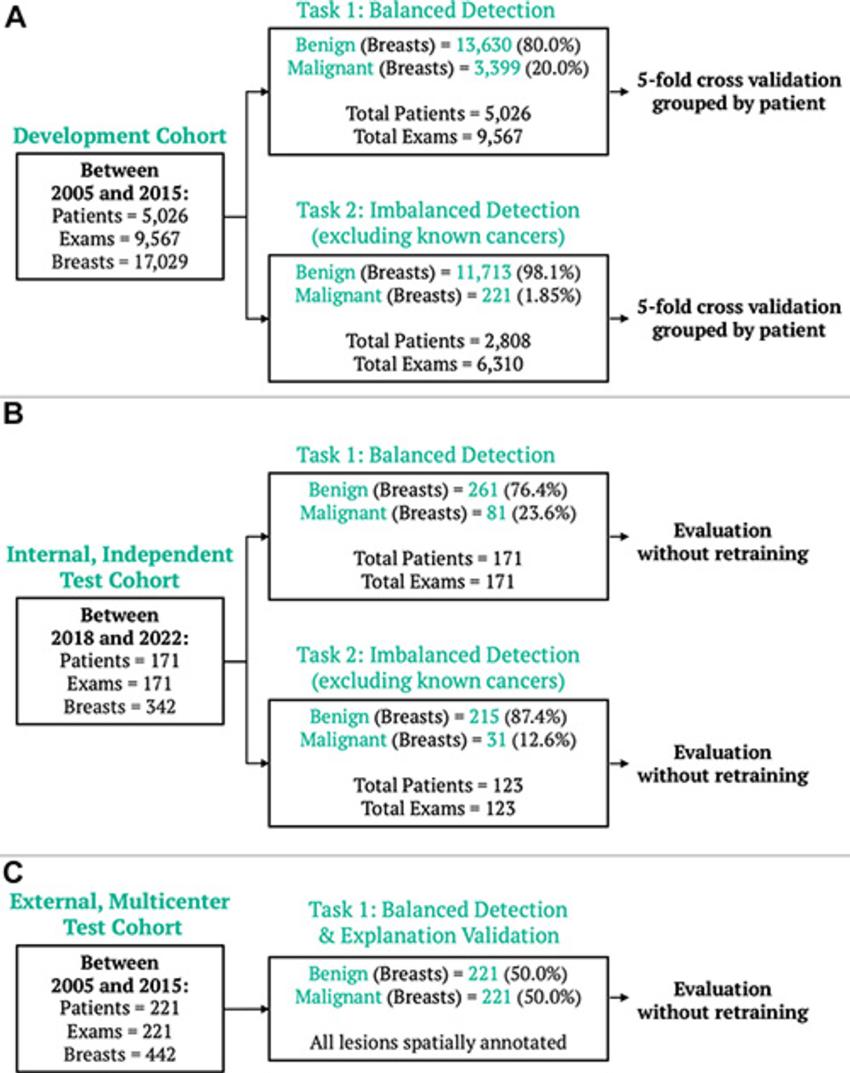
Figure 2. Breast MRI datasets. (A) The model development dataset was composed of data from 5,026 patients. Two detection tasks were defined: balanced detection (which included all data) and imbalanced detection (which excluded MRI scans with known cancers). Evaluation was also performed on two independent datasets: (B) an internal dataset of 171 examinations, evaluated for both the balanced and imbalanced detection tasks, and (C) an external multicenter dataset of 221 examinations, evaluated for the balanced detection task and for spatial model explanations.
High-res (TIF) version
(Right-click and Save As)
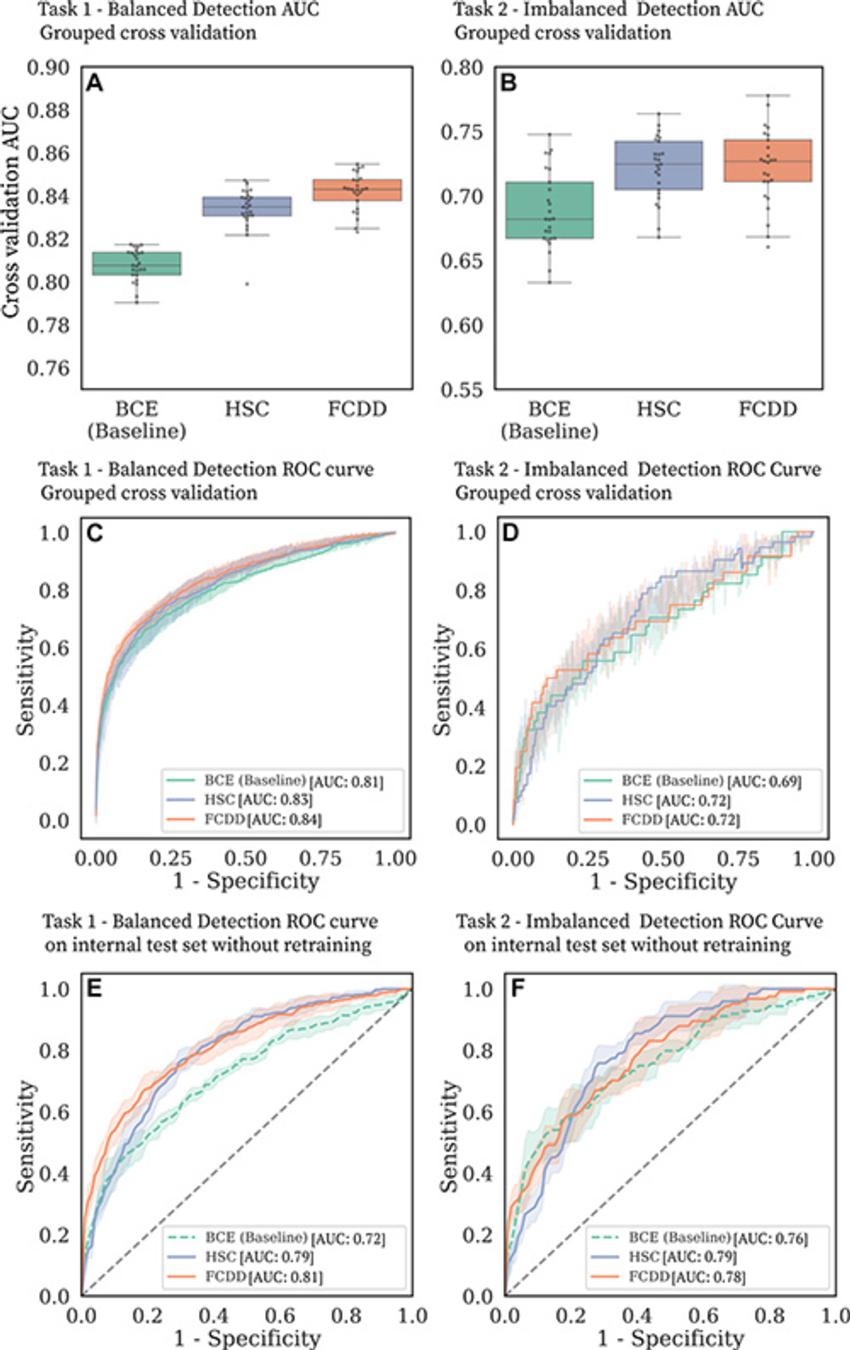
Figure 3. Cancer detection performance on balanced and imbalanced tasks. (A–D) Binary cross-entropy (BCE) is compared with the anomaly detection models hypersphere classification (HSC) and fully convolutional data description (FCDD) in the large model development dataset. (A, B) Box and whisker plots show area under the receiver operating characteristic (ROC) curve (AUC) distributions for (A) task 1 and (B) task 2 for five grouped cross-validation test folds, with five random initializations per fold. (C, D) ROC curves for (C) task 1 and (D) task 2 in grouped cross-validation. The shaded areas correspond to ROC curves for different test folds and random model initializations. (E, F) ROC curves for (E) task 1 and (F) task 2 for the independent internal test set.
High-res (TIF) version
(Right-click and Save As)
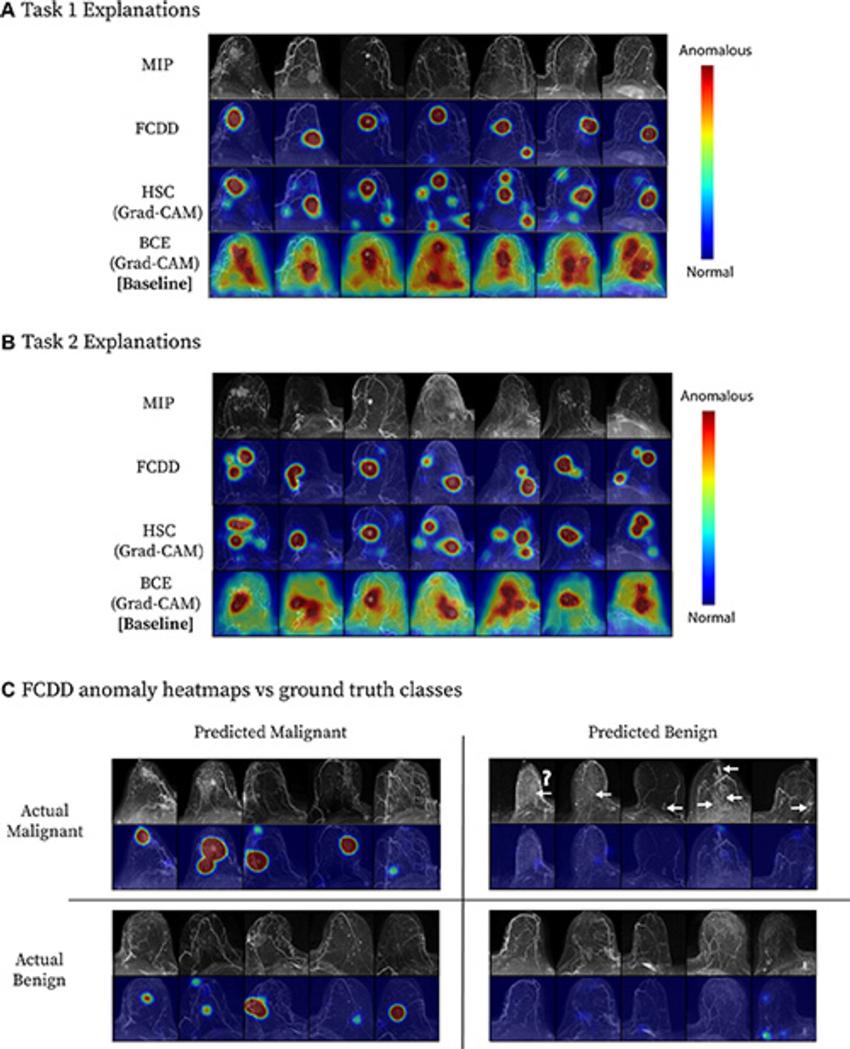
Figure 4. Model explanation heat maps for a cross-validation test fold. (A, B) Explanation maps for a random sample of maximum intensity projections (MIPs) in (A) task 1 and (B) task 2. Fully convolutional data description (FCDD) produces a more specific heat map than those computed for binary cross-entropy (BCE) and hypersphere classification (HSC). (C) Confusion matrix of representative FCDD anomaly heat maps for randomly sampled cases, comparing predictions and actual classes. For breasts with malignancies, locations of missed cancers are indicated by arrows. The question mark denotes a known ductal carcinoma in situ that did not exhibit enhancement at MRI, which may have been due to a high level of background parenchymal enhancement; a common factor of missed cancers was low visibility on the MIP images. Grad-CAM = gradient-weighted class activation mapping.
High-res (TIF) version
(Right-click and Save As)
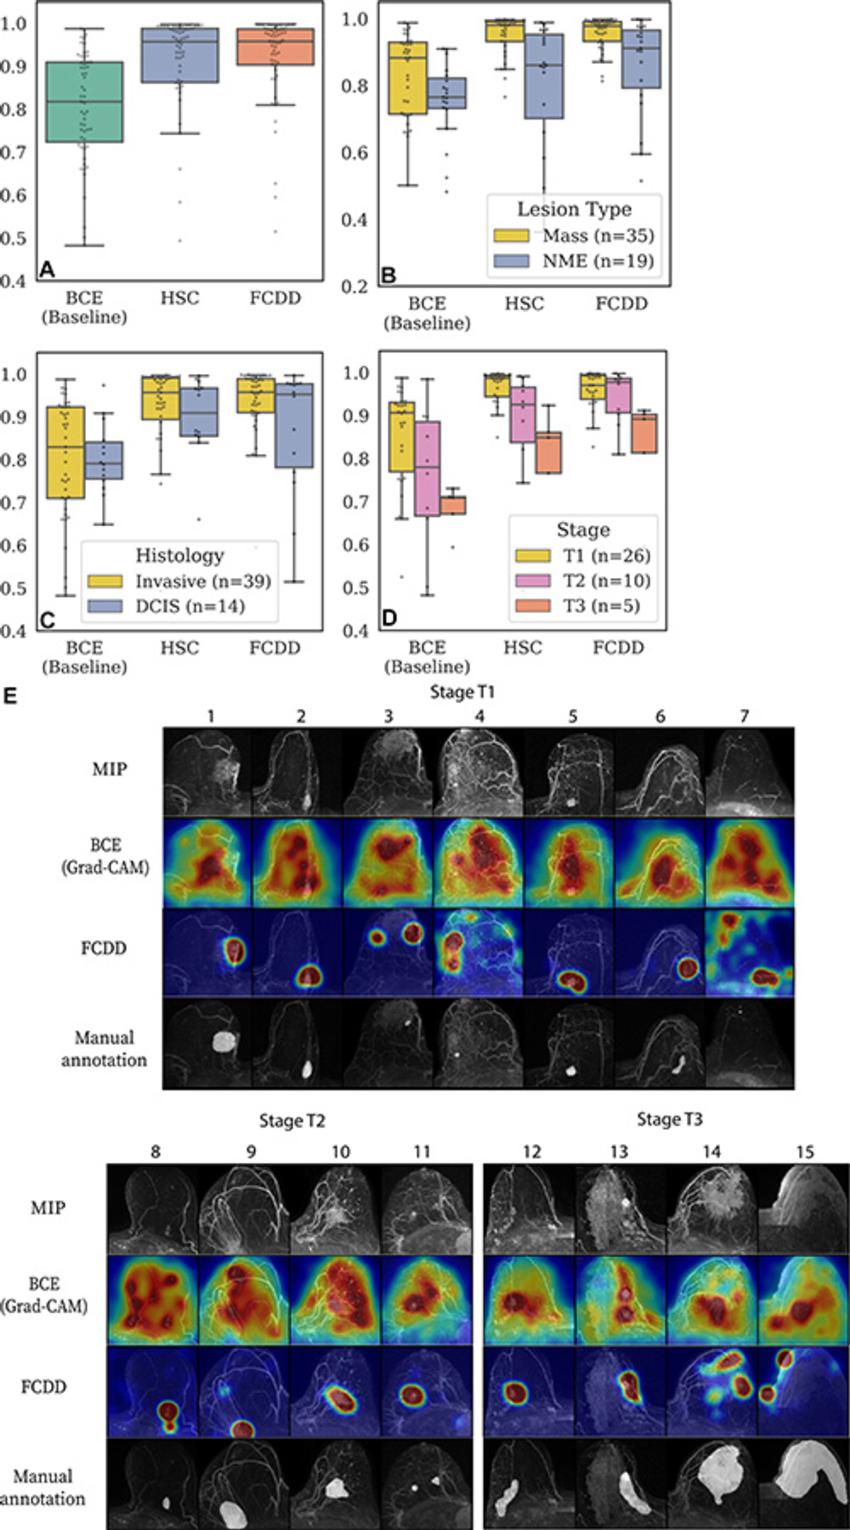
Figure 5. Validation of model explanation heat maps in the lesion-segmented explanation test set. (A–D) Box and whisker plots show pixelwise area under the receiver operating characteristic curve (AUC) for three models—binary cross-entropy (BCE), hypersphere classification (HSC), and fully convolutional data description (FCDD)—using the radiologist retrospective annotation as the reference standard. Each dot corresponds to the pixelwise AUC between an explanation heat map and the radiologist annotation on a breast image. Data are shown for (A) all images in the explanation test set, (B) images stratified by lesion type, (C) images stratified by invasive versus ductal carcinoma in situ (DCIS), and (D) images stratified by T stage for invasive cases. Cases with multiple lesions of different types and histologic characteristics in the same breast were excluded from B (one case) and C (two cases). (E) Maximum intensity projections (MIPs), BCE saliency maps, FCDD anomaly maps, and radiologist annotations are shown for a random sample of test cases with stage T1, T2, and T3 lesions. All explanation maps are locally normalized. Breasts with small lesions (eg, case 7) or multiple lesions (eg, cases 11 and 12) tended to have worse explanations. Larger stage T3 lesions (eg, cases 14 and 15) tended to be poorly explained by the BCE maps; although FCDD maps were more consistent, they tended to underestimate the size of the affected region.
High-res (TIF) version
(Right-click and Save As)