Researchers Identify Texture Patterns Associated with Breast Cancer Risk
Released: May 13, 2025
- RSNA Media Relations
1-630-590-7762
media@rsna.org - Linda Brooks
1-630-590-7738
lbrooks@rsna.org
OAK BROOK, Ill. — In one of the larger studies of its kind, researchers have identified six breast texture patterns that may be associated with increased cancer risk, according to a new study published today in Radiology, a journal of the Radiological Society of North America (RSNA).
Women with dense breasts, which are breasts with a higher proportion of glandular tissue compared to fatty tissue, make up a large proportion of screening-eligible women. Breast cancer can be difficult to detect on mammograms of dense breasts due to the similarity of appearance of dense breast tissue and cancer growths. Both appear white on the image. Dense breasts are also associated with increased breast cancer risk.
Adding to the complexity of the issue is that two women with similar breast density can have substantial differences in their tissue patterns.

Having a greater understanding of the distinct patterns and characteristics of breast tissue, beyond the measurement of breast density, may contribute to improved assessments of breast cancer risk.
"We hypothesized that some patterns or phenotypes would be associated with a high risk of future breast cancer and suggest which women may benefit from supplemental screening or prevention strategies," said one of the senior authors, Celine M. Vachon, Ph.D., a professor of epidemiology at the Mayo Clinic in Rochester, Minnesota. "Other phenotypes could be associated with low risk, ultimately, suggesting less frequent screening."
The researchers used radiomics on the mammograms of over 30,000 women without a prior history of breast cancer from three different screening cohorts. Radiomics extracts large amounts of quantitative features from medical images to identify patterns and characteristics that might not be visible to the human eye.
From the large sample size, the researchers extracted 390 radiomic features that were condensed down into six phenotypes, which are quantifiable characteristics or traits. These six phenotypes were then evaluated on mammograms from over 3,500 women, some who developed breast cancer and some who did not.
Results showed that the radiomic phenotypes were associated with a higher risk of invasive breast cancer in both Black and white women.
"We were surprised to find that these radiomic phenotypes showed suggestion of a stronger risk among Black vs. white women," said co-senior author Despina Kontos, Ph.D., Herbert and Florence Irving Professor of Radiological Sciences and chief research information officer at Columbia University Irving Medical Center. "This is particularly important as breast cancer tends to be more aggressive in Black women, highlighting the need for novel risk factors in this population."
These phenotypes could also predict a woman's chances of receiving a false-negative mammogram (when cancer is missed on a mammogram) or an interval cancer diagnosis (cancer diagnosed in between scheduled screenings).
"Understanding who is at greatest risk of invasive breast cancer, especially the most aggressive types, is crucial for preventing cancer and diagnosing it early for potentially the choice of less intensive treatments," said co-senior author Karla M. Kerlikowske, M.D., professor of medicine and epidemiology and biostatistics at University of California San Francisco.
The authors outlined future applications for these phenotypes and how they can complement existing breast cancer risk models.
"Our next steps include extending our investigations to larger groups of women in the U.S. population, especially examining 3D mammograms, and combining these radiomic risk factors with genetic and other lifestyle factors to improve our ability to define who is (and who is not) at increased risk of invasive breast cancer," Dr. Vachon said.
"Radiomic Parenchymal Phenotypes of Breast Texture from Mammography and Association with Risk of Breast Cancer." Collaborating with Drs. Vachon, Kontos and Kerlikowske were Stacey J. Winham, Ph.D., Anne Marie McCarthy, Ph.D., Christopher G. Scott, M.S., Aimilia Gastounioti, Ph.D., Hannah Horng, Ph.D., Aaron D. Norman, M.P.H., Walter C. Mankowski, Ph.D., Lauren Pantalone, M.P.H., Matthew R. Jensen, B.S., Raymond J. Acciavatti, Ph.D., Andrew D. A. Maidment, Ph.D., Eric A. Cohen, M.S., Kathleen R. Brandt, M.D., and Emily F. Conant, M.D.
Radiology is edited by Linda Moy, M.D., New York University, New York, N.Y., and owned and published by the Radiological Society of North America, Inc. (https://pubs.rsna.org/journal/radiology)
RSNA is an association of radiologists, radiation oncologists, medical physicists and related scientists promoting excellence in patient care and health care delivery through education, research and technologic innovation. The Society is based in Oak Brook, Illinois. (RSNA.org)
For patient-friendly information on mammography, visit RadiologyInfo.org.
Images (JPG, TIF):
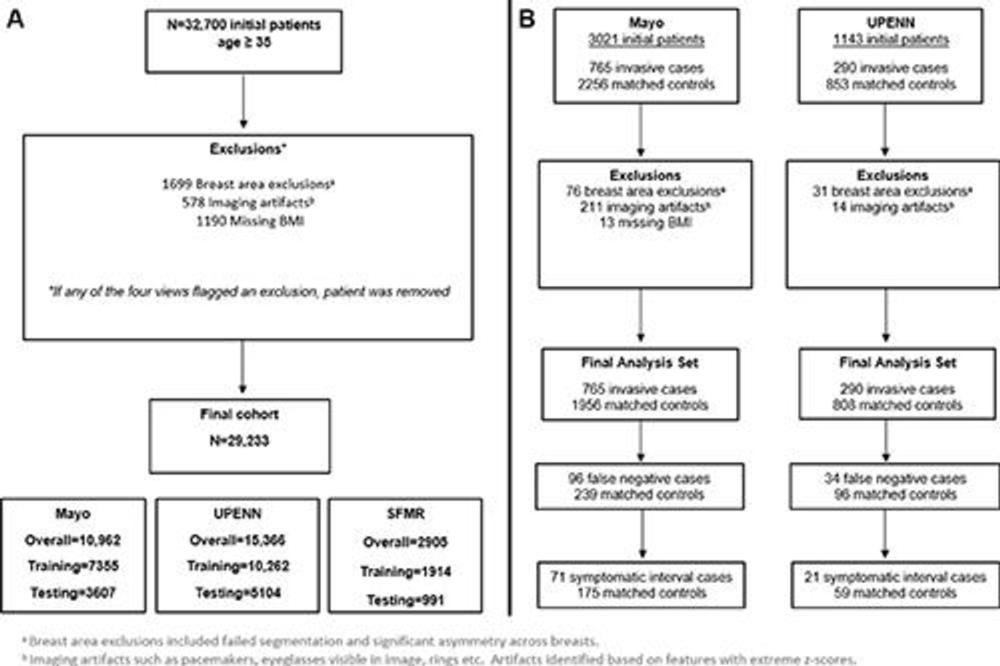
Figure 1. Consolidated Standards of Reporting Trials (known as CONSORT) diagrams for (A) radiomic phenotype discovery stage 1 and (B) association of phenotypes with invasive breast cancer outcomes stage 2. BMI = body mass index (calculated as weight in kilograms divided by height in meters squared), Mayo = Mayo Clinic, SFMR = San Francisco Mammography Registry, UPENN = University of Pennsylvania.
High-res (TIF) version
(Right-click and Save As)
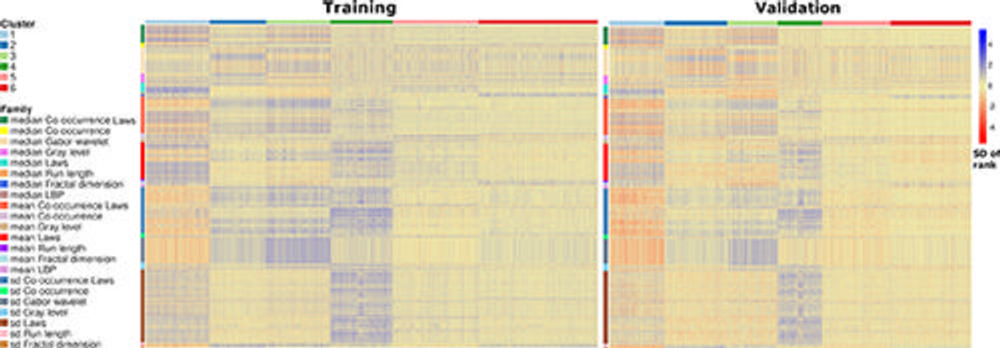
Figure 2. Heatmaps show the hierarchical clustering of 390 radiomic features in the training and validation sets. Feature values are plotted for each woman per feature (color indicates SD of the feature rank). Women are represented in columns (column color indicates the six clusters), and the radiomic features are in rows (row color indicates the radiomic feature family). LBP = local binary pattern, sd = standard deviation
High-res (TIF) version
(Right-click and Save As)
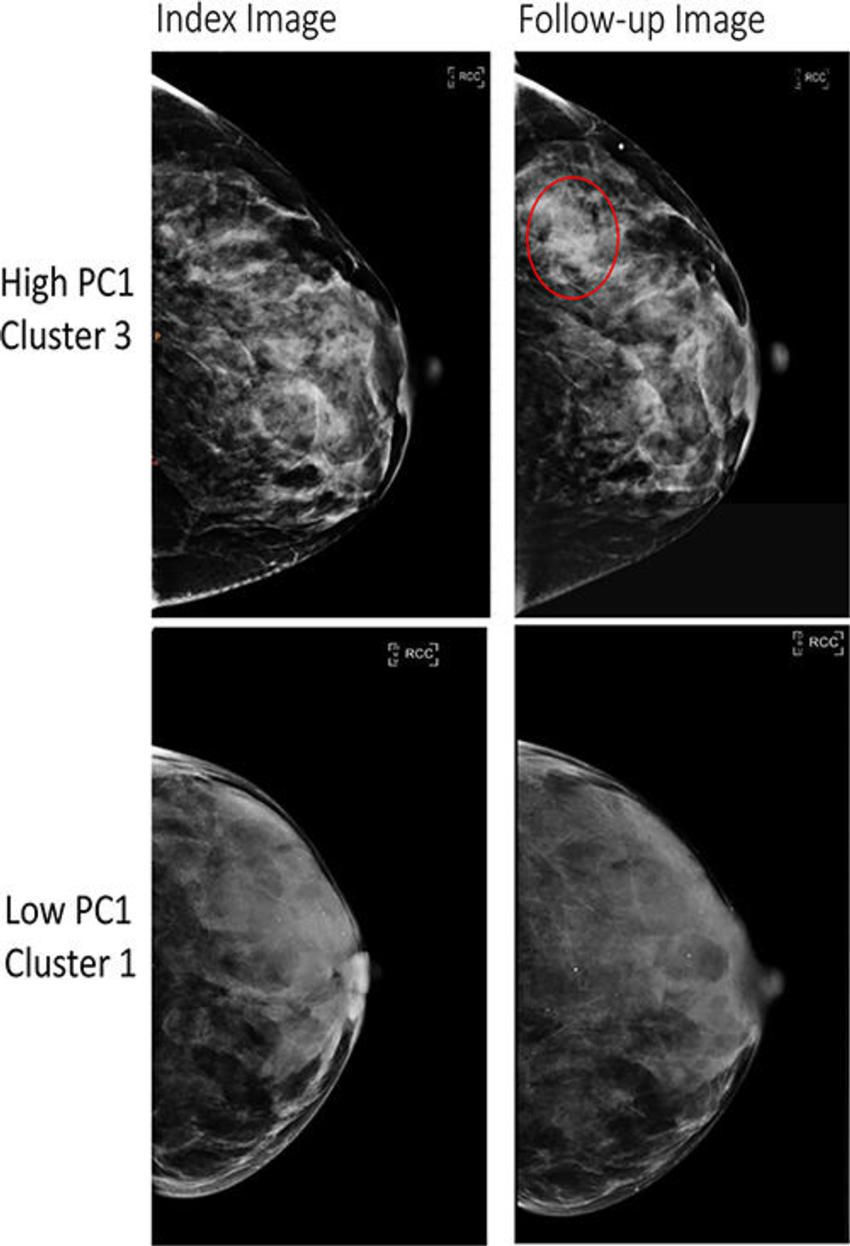
Figure 3. Full-field digital mammography (FFDM) images in a 52-year-old woman show a high-risk phenotype (top), and FFDM images in a 58-year-old woman show a low-risk phenotype (bottom). The high-risk phenotype was defined by having high values of the first principal component (PC1) and was assigned to cluster 3 (top row), and the low-risk phenotype was defined by having low values of the PC1 and was assigned to cluster 1 (bottom row). The index images (left side; before any diagnosis of cancer) are provided as well as follow-up images obtained at either the time of cancer diagnosis (for the high-risk phenotype, top right) or at the last follow-up (low-risk phenotype, bottom right). The red circle indicates the location of subsequent breast cancer. Both women had a Breast Imaging Reporting and Data System breast density of C. The woman at high risk for breast cancer was Black and the woman at low risk for breast cancer was White.
High-res (TIF) version
(Right-click and Save As)
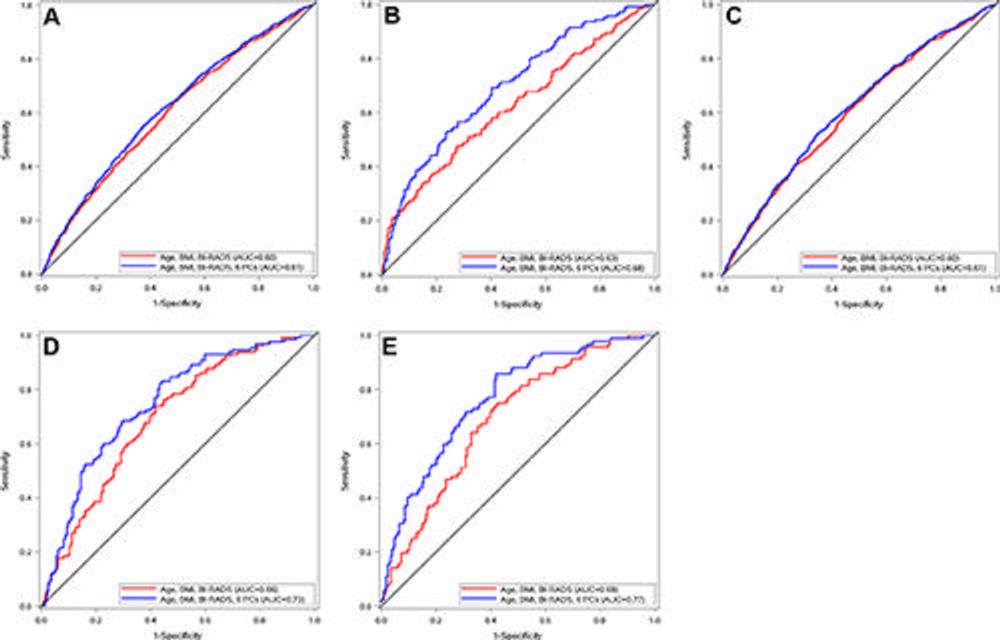
Figure 4. Receiver operating characteristic curves for predicted breast cancer outcomes among women in the stage 2 case-control sample adjusted for age, body mass index (BMI; calculated as weight in kilograms divided by height in meters squared), and Breast Imaging Reporting and Data System (BI-RADS) density alone (red) or with principal component (PC) phenotypes (blue). Black lines refer to a null value of area under the receiver operating characteristic curve (AUC) of 0.5. Receiver operating characteristic curves show (A) overall invasive breast cancer in all women, (B) overall invasive breast cancer in Black women, (C) overall invasive breast cancer in White women, (D) false-negative examination findings, and (E) symptomatic interval cancers.
High-res (TIF) version
(Right-click and Save As)