Brain Connectivity on MRI Predicts Parkinson’s Disease Progression
Released: June 25, 2024
- RSNA Media Relations
1-630-590-7762
media@rsna.org - Linda Brooks
1-630-590-7738
lbrooks@rsna.org - Imani Harris
1-630-481-1009
iharris@rsna.org
OAK BROOK, Ill. — The structural and functional organization of the brain as shown on MRI can predict the progression of brain atrophy in patients with early-stage, mild Parkinson's disease, according to a study published today in Radiology, a journal of the Radiological Society of North America (RSNA).
Parkinson's disease is a progressive disorder characterized by tremors, slowness of movement or rigidity. Symptoms worsen over time and may include cognitive impairment and sleep problems. The disease affects more than 8.5 million people worldwide, and prevalence has doubled in the past 25 years, according to the World Health Organization (WHO).
One of the distinctive features of Parkinson's disease is the presence of altered versions of the protein alpha-synuclein in the brain. Normally present in the brain, this protein accumulates as misfolded clumps inside nerve cells in Parkinson's disease, forming structures known as Lewy bodies and Lewy neurites. These clumps spread to other brain regions, damaging nerves.
Researchers wanted to see if mapping the structural and functional connections across the brain could be used to predict patterns of atrophy spread in patients with mild Parkinson's disease.
They used MRI data from 86 patients with mild Parkinson's disease and 60 healthy control participants to generate the connectome, a structural/functional map of the brain's neural connections. The researchers used the connectome to develop an index of disease exposure.

Disease exposure at one year and two years was correlated with atrophy at two years and three years post-baseline. Models including disease exposure predicted gray matter atrophy accumulation over three years in several areas of the brain.
"In the present study, brain connectome, both structural and functional, showed the potential to predict progression of gray matter alteration in patients with mild Parkinson's disease," said study coauthor Federica Agosta, M.D., Ph.D., associate professor of neurology at the Neuroimaging Research Unit of IRCCS San Raffaele Scientific Institute in Milan, Italy.
The findings support the theory that functional and structural connections between brain regions may significantly contribute to Parkinson's disease progression.
"The loss of neurons and accumulation of abnormal proteins can disrupt neural connections, compromising the transmission of neural signals and the integration of information across different brain regions," Prof. Agosta said.
The study results point to a role for MRI in intervention trials to prevent or delay the disease progression—especially when individual patient information is incorporated into the model. Since Parkinson's disease progression likely differs among individuals, future models should consider different starting conditions and incorporate individual-specific information for optimal effectiveness, according to Prof. Agosta.
"We believe that understanding the organization and dynamics of the human brain network is a pivotal goal in neuroscience, achievable through the study of the human connectome," she said. "The idea that this approach could help identify different biomarkers capable of modulating Parkinson's disease progression inspires our work."
"Brain Connectivity Networks Constructed Using MRI for Predicting Patterns of Atrophy Progression in Parkinson's Disease." Collaborating with Prof. Agosta were Silvia Basaia, Ph.D., Elisabetta Sarasso, M.Sc., Roberta Balestrino, M.D., Tanja Stojkovic, M.D., Ph.D., Iva Stanković, M.D., Ph.D., Aleksandra Tomić, M.D., Ph.D., Vladana Marković, M.D., Ph.D., Francesca Vignaroli, M.D., Elka Stefanova, M.D., Ph.D., Vladimir S. Kostić, M.D., Ph.D., and Massimo Filippi, M.D., F.E.A.N., F.A.A.N.
Radiology is edited by Linda Moy, M.D., New York University, New York, N.Y., and owned and published by the Radiological Society of North America, Inc. (https://pubs.rsna.org/journal/radiology)
RSNA is an association of radiologists, radiation oncologists, medical physicists and related scientists promoting excellence in patient care and health care delivery through education, research and technologic innovation. The Society is based in Oak Brook, Illinois. (RSNA.org)
For patient-friendly information on brain MRI, visit RadiologyInfo.org.
Images (JPG, TIF):
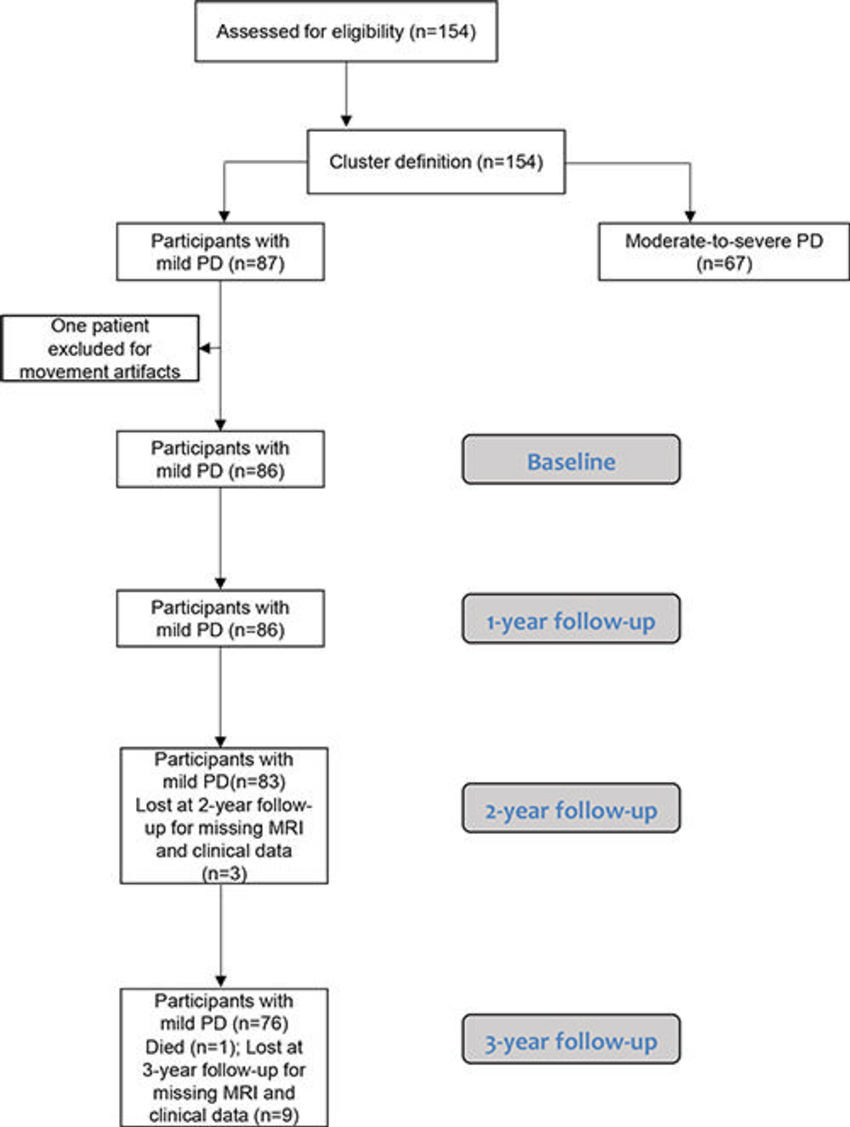
Figure 1. Flow diagram indicating the inclusion and exclusion process for the study cohort. PD = Parkinson disease.
High-res (TIF) version
(Right-click and Save As)
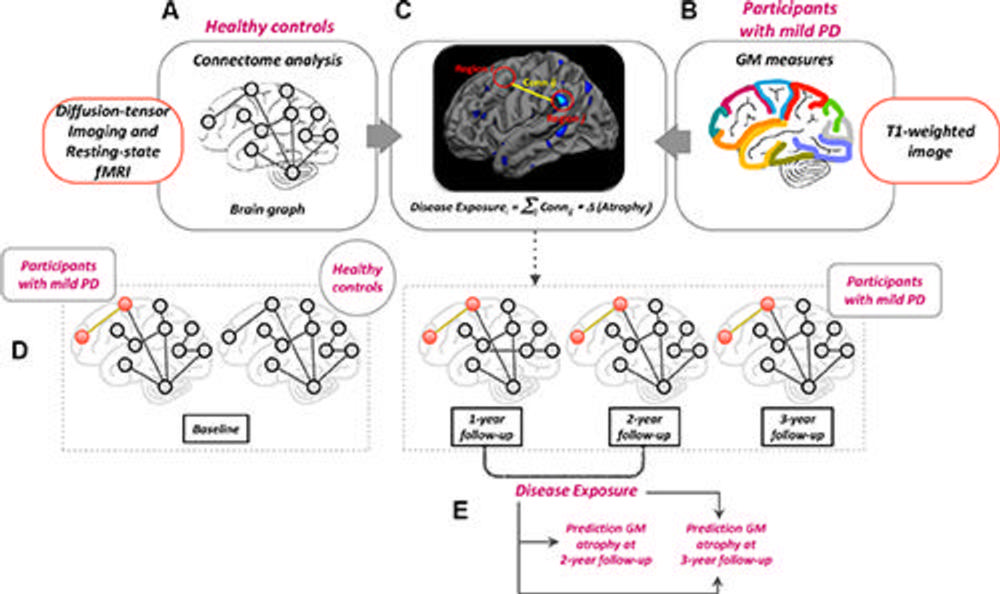
Figure 2. Diagram of study methods. (A) The structural and functional brain connectome in healthy controls at baseline was constructed. (B) Cortical thickness and gray matter (GM) volume were measured on three-dimensional T1-weighted images in participants with mild Parkinson disease (PD) (all visits) and healthy controls (baseline). (C) Disease exposure indexes—indexes of pathology in each brain region calculated at 1- and 2-year follow-up—were defined as a function of the structural and functional connectivity of each brain region relative to the connected brain regions in the connectome of healthy controls and the severity of atrophy of the connected regions in participants with PD. (D) Differences in cortical thickness or GM volume at baseline in participants with mild PD compared with healthy controls were estimated, as well as changes over 1, 2, and 3 years of follow-up in participants with mild PD. (E) Prediction models were used to evaluate GM atrophy changes in brain regions over time in participants with mild PD. fMRI = functional MRI.
High-res (TIF) version
(Right-click and Save As)
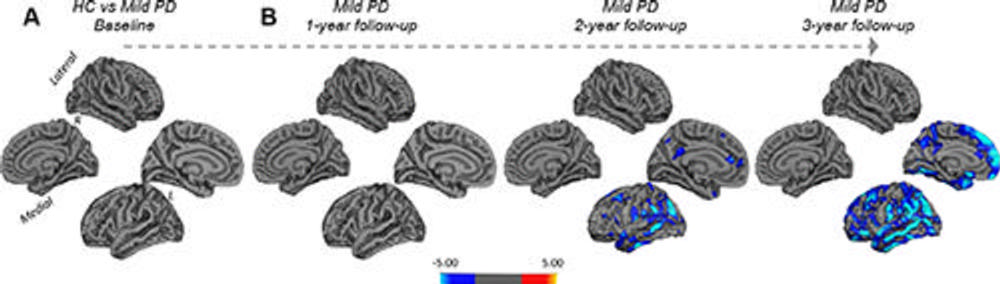
Figure 3. Gray matter atrophy patterns in participants with mild Parkinson disease (PD) (A) at baseline compared with healthy controls (HC) (general linear model in FreeSurfer adjusted for age) and (B) at 1-, 2-, and 3-year follow-up. Color bar represents t values. L = left, R = right. (Figure adapted, with permission, from Filippi M., Sarasso E., Piramide N., et al. “Progressive Brain Atrophy and Clinical Evolution in Parkinson’s Disease”)
High-res (TIF) version
(Right-click and Save As)
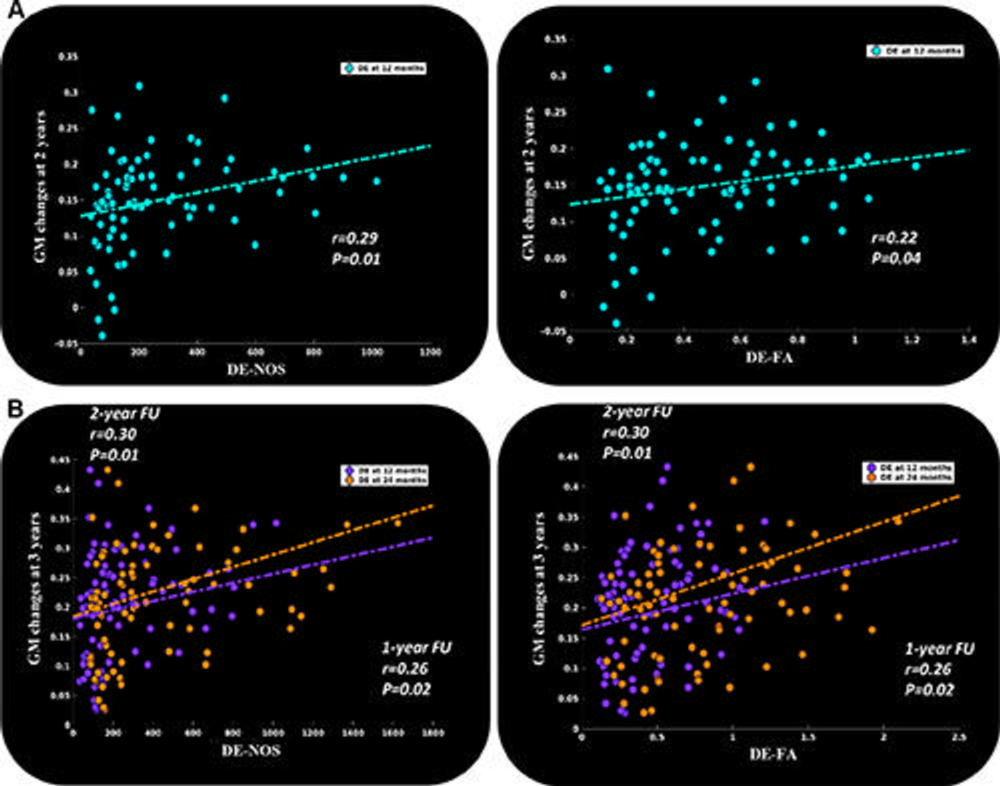
Figure 4. Scatter plots show the partial correlation between gray matter (GM) atrophy progression and structural connectivity disease exposure (DE) indexes calculated with number of streamlines (NOS) and fractional anisotropy (FA) for each GM region in participants with mild Parkinson disease. Partial correlations are shown for (A) the DE indexes at 1 year and GM atrophy at 2 years and (B) the DE indexes at 1 year (purple) and 2 years (orange) and GM atrophy at 3 years. Dots represent all 83 brain regions for each analysis. The dotted lines show the general trends of the relationships between the variables. FU = follow-up.
High-res (TIF) version
(Right-click and Save As)
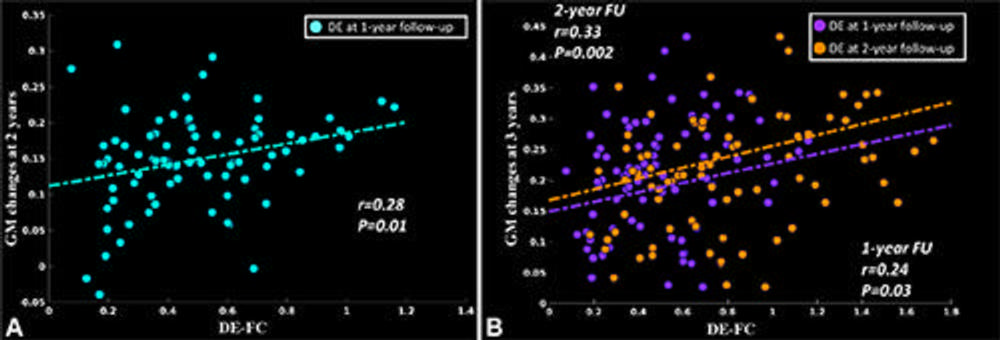
Figure 5. Scatter plots show the partial correlation between gray matter (GM) atrophy progression and the functional connectivity (FC) disease exposure (DE) index for each GM region in participants with mild Parkinson disease. Partial correlations are shown for (A) the DE index at 1 year and GM atrophy at 2 years and (B) the DE index at 1 year (purple) and 2 years (orange) and GM atrophy at 3 years. Dots represent all 83 brain regions for each analysis. The dotted lines show the general trends of the relationships between the variables. FU = follow-up.
High-res (TIF) version
(Right-click and Save As)