Lung Abnormality Progression Linked to Acute Respiratory Disease in Smokers
Released: April 30, 2024
- RSNA Media Relations
1-630-590-7762
media@rsna.org - Linda Brooks
1-630-590-7738
lbrooks@rsna.org - Imani Harris
1-630-481-1009
iharris@rsna.org
OAK BROOK, Ill. — Smokers who have small abnormalities on their CT scans that grow over time have a greater likelihood of experiencing acute respiratory disease events, according to a new study published today in Radiology, a journal of the Radiological Society of North America (RSNA).
Quantitative interstitial abnormalities (QIA) are subtle abnormalities on chest CTs that do not meet the diagnostic criteria for advanced pulmonary diseases but are nonetheless associated with decreased lung function and capacity, increased respiratory symptoms and death.

"QIA includes features like reticulation and ground-glass opacities as well as subtle density changes with important clinical implications," said Bina Choi, M.D., associate physician in the Division of Pulmonary and Critical Care Medicine at Brigham and Women's Hospital and postdoctoral fellow at the Applied Chest Imaging Laboratory, Harvard Medical School in Boston. "In some patients, QIA may be a precursor to advanced diseases such as pulmonary fibrosis or emphysema."
Acute respiratory disease events are episodes of increased cough, phlegm or shortness of breath that last at least two days and require treatment with steroids or antibiotics. Severe acute respiratory disease episodes require an emergency room visit or hospitalization.
"We wanted to determine whether progression in QIA on chest CT is associated with acute respiratory disease events in individuals with a history of smoking," Dr. Choi said. "While many acute respiratory disease events are likely related to airway disease and COPD, some may instead be associated with QIA especially in people without obstruction or emphysema."
Dr. Choi's team performed a secondary analysis of the CT scans of 3,972 participants (mean age 60.7; 2,120 women) in the COPDGene® Study, one of the largest studies ever to investigate the underlying genetic factors of COPD. The study included individuals with a 10-pack-year or greater smoking history recruited from multiple centers between November 2007 and July 2017.
QIA was measured with machine learning-based tools as a percentage of lung volume on a CT scan. QIA progression was assessed using the participants' QIA measurements at baseline and five-year follow-up CT exams.
Statistical analyses revealed that participants in the highest quartile of QIA progression had more frequent acute respiratory disease and severe acute respiratory disease events than those in the lowest quartile.
"We found that progression in QIA is independently associated with these acute respiratory disease events both intercurrent and subsequent to progression," she said.
Dr. Choi said the results suggest that QIA progression may represent changes in lung tissue processes that have both short- and long-term impacts on patient symptoms and the worsening of those symptoms.
"Severe acute respiratory disease events may be a sign of disease activity and a source of morbidity at the earliest stages of lung tissue injury," she said. "Some people with QIA progression may merit more aggressive monitoring and earlier intervention."
"Association of Acute Respiratory Disease Events with Quantitative Interstitial Abnormality Progression at CT in Individuals with a History of Smoking." Collaborating with Dr. Choi were Alejandro A. Diaz, M.D., M.P.H., Ruben San José Estépar, M.S., Nicholas Enzer, B.S., Victor Castro, B.A., MeiLan K. Han, M.D., M.S., George R. Washko, M.D., M.M.Sc., Raúl San José Estépar, Ph.D., and Samuel Y. Ash, M.D., M.P.H., for the COPDGene Study
Radiology is edited by Linda Moy, M.D., New York University, New York, N.Y., and owned and published by the Radiological Society of North America, Inc. (https://pubs.rsna.org/journal/radiology)
RSNA is an association of radiologists, radiation oncologists, medical physicists and related scientists promoting excellence in patient care and health care delivery through education, research and technologic innovation. The Society is based in Oak Brook, Illinois. (RSNA.org)
For patient-friendly information on chest CT, visit RadiologyInfo.org.
Images (JPG, TIF):

Figure 1. Consolidated Standards of Reporting Trials, or CONSORT, flow diagram of participant inclusion criteria. QIA = quantitative interstitial abnormality.
High-res (TIF) version
(Right-click and Save As)
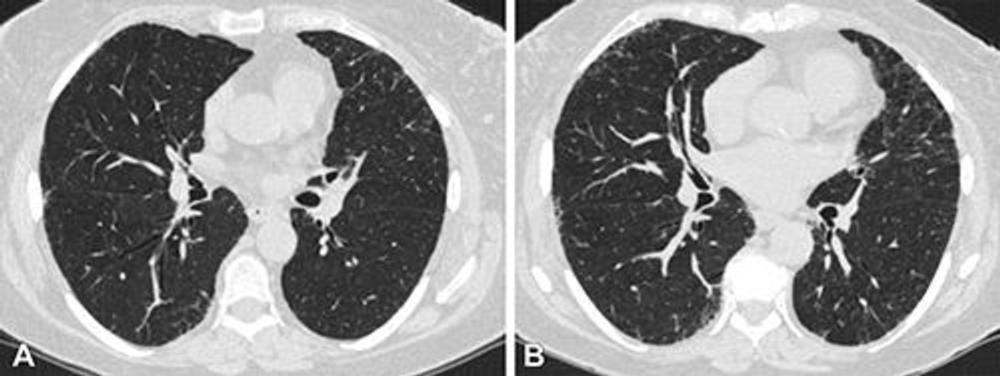
Figure 2. Axial chest CT scans at (A) visit 1 and (B) visit 2 at the level of the takeoff of the right middle bronchus of a participant with 1.2 annual percentage quantitative interstitial abnormality progression. The female participant was 62 years old at visit 1 and 67 years old at visit 2 and a current smoker at both visits, with a 47.5 pack-year history at visit 2. This participant had four subsequent acute respiratory disease (ARD) events and three subsequent severe ARD events.
High-res (TIF) version
(Right-click and Save As)

Figure 3. Schematic shows the measurement of quantitative interstitial abnormality (QIA) progression at CT between visits 1 and 2 and the relative measurements of intercurrent acute respiratory disease (ARD) and subsequent ARD events by means of the longitudinal follow-up (LFU) program questionnaires. Dotted lines for LFU visits are provided as examples; they are not to scale, and not all LFU visits are shown. These questionnaires were conducted every 3 to 6 months between visits 1 and 2 and after visit 2, and they were used to evaluate ARD events and severe ARD events. Intercurrent events are those that occurred during the measurement of QIA progression or between visits 1 and 2; subsequent events are those that occurred after the measurement of QIA progression or after visit 2.
High-res (TIF) version
(Right-click and Save As)

Figure 4. Forest plot shows odd ratios (ORs) of acute respiratory disease (ARD) events and severe ARD events per annual rate of percentage quantitative interstitial abnormality (QIA) and emphysema progression. The annual rate of progression was defined as the increase in percentage of QIA or emphysema between visits 1 and 2, divided by the number of years between visits 1 and 2, respectively. ORs were calculated using an adjusted multivariable logistic regression analysis. Circles represent the ORs, and whiskers represent the 95% CIs. The vertical dotted line represents OR of 1.00.
High-res (TIF) version
(Right-click and Save As)