Researchers Develop Deep Learning Model to Predict Breast Cancer
Released: March 19, 2024
- RSNA Media Relations
1-630-590-7762
media@rsna.org - Linda Brooks
1-630-590-7738
lbrooks@rsna.org - Imani Harris
1-630-481-1009
iharris@rsna.org
One in 8 women, or approximately 13% of the female population in the U.S., will develop invasive breast cancer in their lifetime and 1 in 39 women (3%) will die from the disease, according to the American Cancer Society. Breast cancer screening with mammography, for many women, is the best way to find breast cancer early when treatment is most effective. Having regularly scheduled mammograms can significantly lower the risk of dying from breast cancer. However, it remains unclear how to precisely predict which women will develop breast cancer through screening alone.
Mirai, a state-of-the-art, deep learning-based algorithm, has demonstrated proficiency as a tool to help predict breast cancer but, because little is known about its reasoning process, the algorithm has the potential for overreliance by radiologists and incorrect diagnoses.

"Mirai is a black box—a very large and complex neural network, similar in construction to ChatGPT—and no one knew how it made its decisions," said the study's lead author, Jon Donnelly, B.S., a Ph.D. student in the Department of Computer Science at Duke University in Durham, North Carolina. "We developed an interpretable AI method that allows us to predict breast cancer from mammograms 1 to 5 years in advance. AsymMirai is much simpler and much easier to understand than Mirai."
For the study, Donnelly and colleagues in the Department of Computer Science and Department of Radiology compared their newly developed mammography-based deep learning model called AsymMirai to Mirai's 1- to 5-year breast cancer risk predictions. AsymMirai was built on the "front end" deep learning portion of Mirai, while replacing the rest of that complicated method with an interpretable module: local bilateral dissimilarity, which looks at tissue differences between the left and right breasts.
"Previously, differences between the left and right breast tissue were used only to help detect cancer, not to predict it in advance," Donnelly said. "We discovered that Mirai uses comparisons between the left and right sides, which is how we were able to design a substantially simpler network that also performs comparisons between the sides."
For the study, the researchers compared 210,067 mammograms from 81,824 patients in the EMory BrEast imaging Dataset (EMBED) from January 2013 to December 2020 using both Mirai and AsymMirai models. The researchers found that their simplified deep learning model performed almost as well as the state-of-the-art Mirai for 1- to 5-year breast cancer risk prediction.
The results also supported the clinical importance of breast asymmetry and, as a result, highlights the potential of bilateral dissimilarity as a future imaging marker for breast cancer risk.
Since the reasoning behind AsymMirai's predictions is easy to understand, it could be a valuable adjunct to human radiologists in breast cancer diagnoses and risk prediction, Donnelly said.
"We can, with surprisingly high accuracy, predict whether a woman will develop cancer in the next 1 to 5 years based solely on localized differences between her left and right breast tissue," he said. "This could have public impact because it could, in the not-too-distant future, affect how often women receive mammograms."
"AsymMirai: Interpretable Mammography-based Deep Learning Model for 1–5-year Breast Cancer Risk Prediction." Collaborating with Jon Donnelly were Luke Moffett, M.S., Alina Jade Barnett, M.S., Ph.D., Hari Trivedi, M.D., Fides Schwartz, M.D., Joseph Lo, Ph.D., and Cynthia Rudin, Ph.D.
Radiology is edited by Linda Moy, M.D., New York University, New York, N.Y., and owned and published by the Radiological Society of North America, Inc. (https://pubs.rsna.org/journal/radiology)
RSNA is an association of radiologists, radiation oncologists, medical physicists and related scientists promoting excellence in patient care and health care delivery through education, research and technologic innovation. The Society is based in Oak Brook, Illinois. (RSNA.org)
For patient-friendly information on breast imaging, visit RadiologyInfo.org.
Images (JPG, TIF):
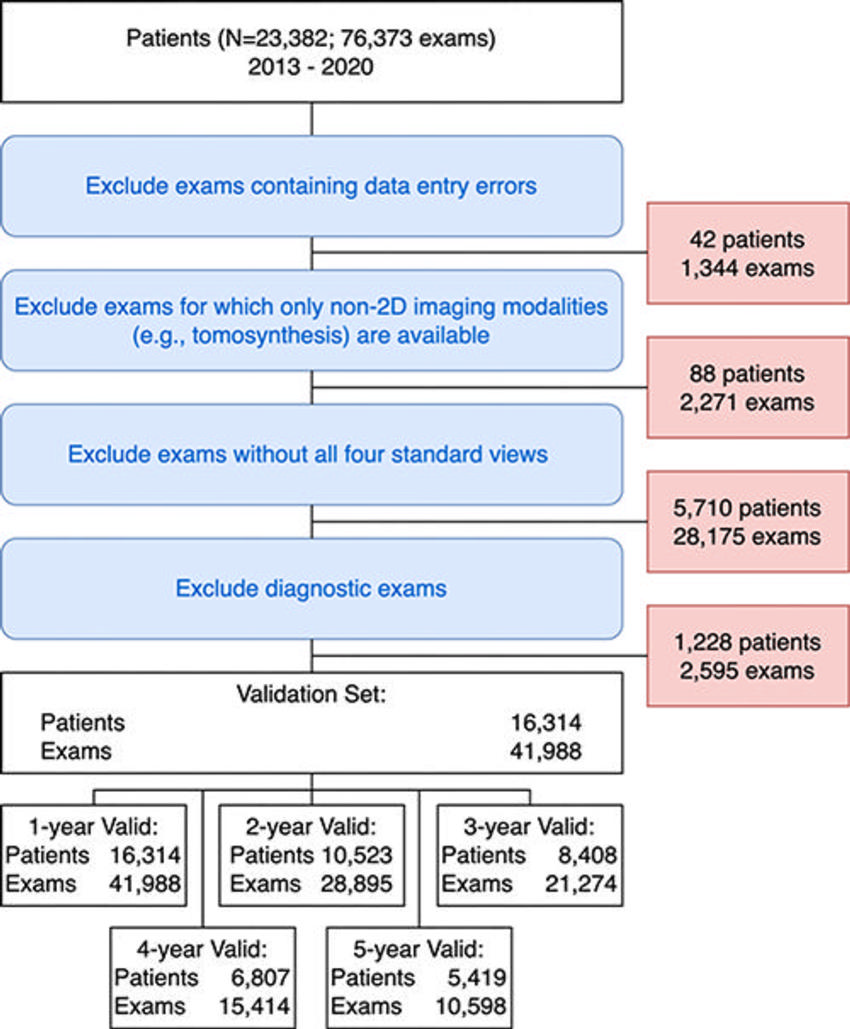
Figure 1. Exclusion flowchart for the validation cohort. The EMory BrEast imaging Dataset (EMBED) validation split included 23,382 patients and 76,373 examinations from 2013 to 2020. Examinations with data abnormalities (42 patients, 1,344 examinations), examinations without two-dimensional (2D) images (88 patients, 2,271 examinations), examinations without all four screening views (5,810 patients, 28,175 examinations), and diagnostic examinations (1,228 patients, 2,595 examinations) were excluded. The resulting cohort included 16,314 patients with 41,988 examinations. The number of patients and examinations with sufficient follow-up data to evaluate 1-year (16,314 patients, 41,988 examinations), 2-year (10,523 patients, 28,895 examinations), 3-year (8,408 patients, 21,274 examinations), 4-year (6,807 patients, 15,414 examinations), and 5-year (5,419 patients, 10,598 examinations) areas under the receiver operating characteristic curve are at the bottom of the figure.
High-res (TIF) version
(Right-click and Save As)
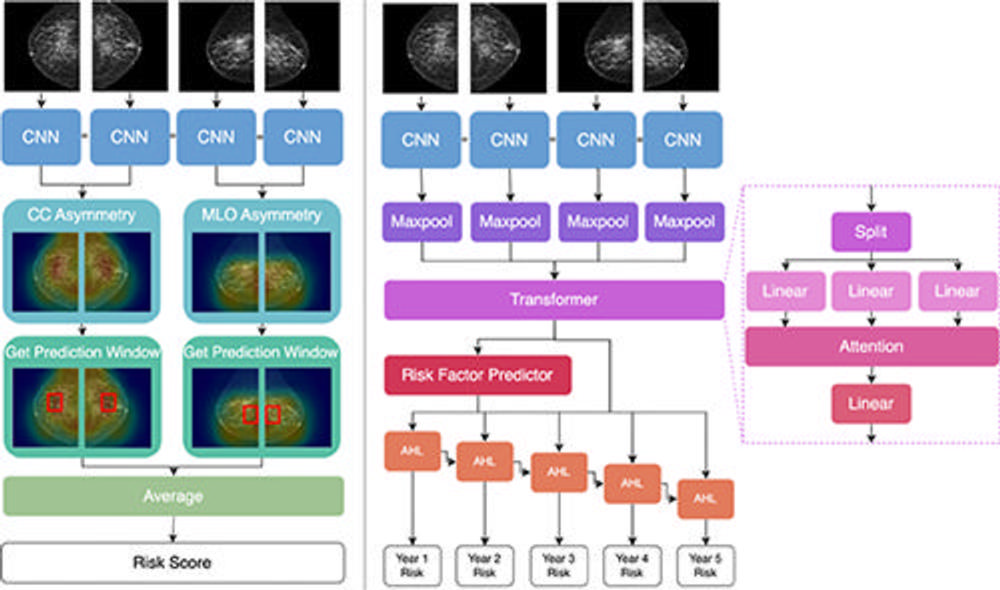
Figure 2. Architecture comparison of AsymMirai (left) and Mirai (right). Both models feed the four screening views into the same convolutional neural network (CNN) layers, but reasoning diverges thereafter. AsymMirai has fewer computational layers and instead calculates differences in the latent features, as shown by heat maps in the craniocaudal (CC) asymmetry and mediolateral oblique (MLO) asymmetry steps. AsymMirai then finds the prediction window containing the highest differences for each view, represented by red boxes in the Get Prediction Window step. The maximum feature differences within these windows are averaged to create a risk score. AHL = additive hazard layer.
High-res (TIF) version
(Right-click and Save As)
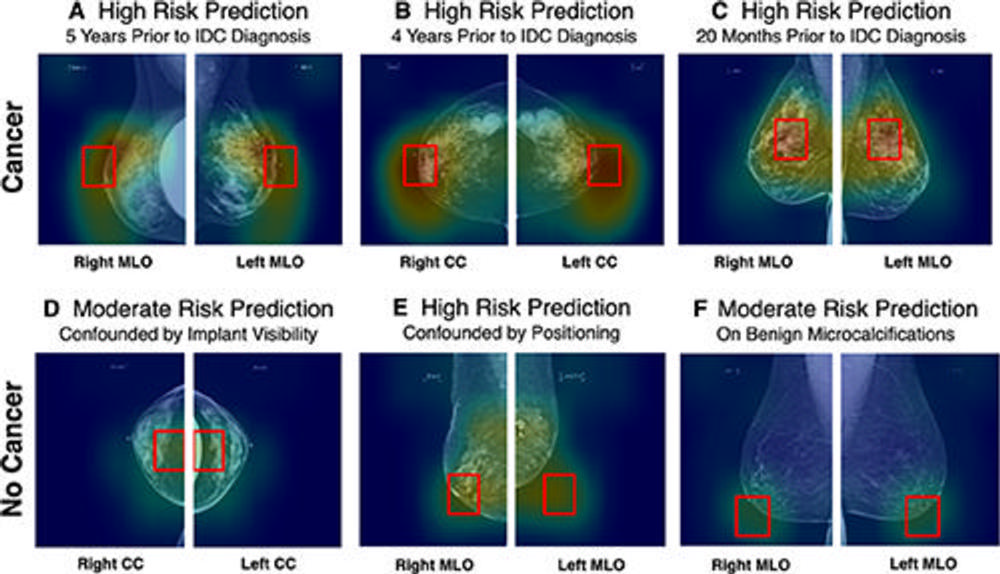
Figure 3. AsymMirai model outputs. Input images are full-field screening mammograms. The two bilateral screening images are overlayed within the heat map, and the prediction window (red box) indicates the area with the highest dissimilarity. The heat map and prediction window are visualizations of AsymMirai’s model outputs, not post hoc saliency maps such as GradCAM. Analyzing these outputs provides a deeper understanding of the scores, in these cases distinguishing confounded reasoning from nonconfounded reasoning for patients with macro asymmetries. (A–C) Images in patients who developed cancer within 1–5 years. (A) In a 49-year-old White woman with unilateral breast augmentation who underwent annual screening, AsymMirai predicted high risk for developing cancer. Biopsy confirmed invasive ductal carcinoma in the right breast 5 years later. The prediction window was not affected by the unilateral implant. (B) In a 43-year-old African American woman with initial screening at 42 years old, AsymMirai predicted high risk of developing cancer. The prediction window corresponds to retroareolar asymmetry. Biopsy performed 4 years later confirmed invasive ductal carcinoma in the right breast. Intramammary lymph nodes were correctly ignored. (C) In a 50-year-old African American woman with regular screening and coarse heterogenous calcifications at the 12-o’clock position, AsymMirai predicted high risk for developing cancer. Biopsy confirmed bilateral invasive ductal carcinoma 20 months later, with the cancer in the left breast occurring in the 12-o’clock position. (D–F) Images in patients who did not develop cancer but had identifiably confounded risk predictions. (D) In a 60-year-old White woman with bilateral breast augmentation and regular screening mammograms, AsymMirai predicted moderate risk for developing cancer, confounded by artificial asymmetry caused by the exclusion of the implant from the right craniocaudal view. (E) In a 73-year-old White woman with regular screening mammograms and known dystrophic calcifications in the left breast, AsymMirai predicted high risk for developing cancer, confounded by poor positioning in the left mediolateral oblique view and possible distortion in the right mediolateral oblique view. (F) In a 65-year-old African American woman with bilateral benign microcalcifications, AsymMirai predicted moderate risk for developing cancer, confounded by the calcifications. Among the patients with no cancer, Mirai correctly identified the patient in D as having a low risk for developing cancer (20th percentile risk) but also misclassified patients in E and F (84th and 95th percentiles, respectively). These examples were chosen without knowledge of Mirai’s risk scores. Unlike when reviewing the tissue in AsymMirai prediction window, there is no way to ex ante identify the cases where Mirai was confounded because it produces only a score. CC = craniocaudal, IDC = invasive ductal carcinoma, MLO = mediolateral oblique.
High-res (TIF) version
(Right-click and Save As)
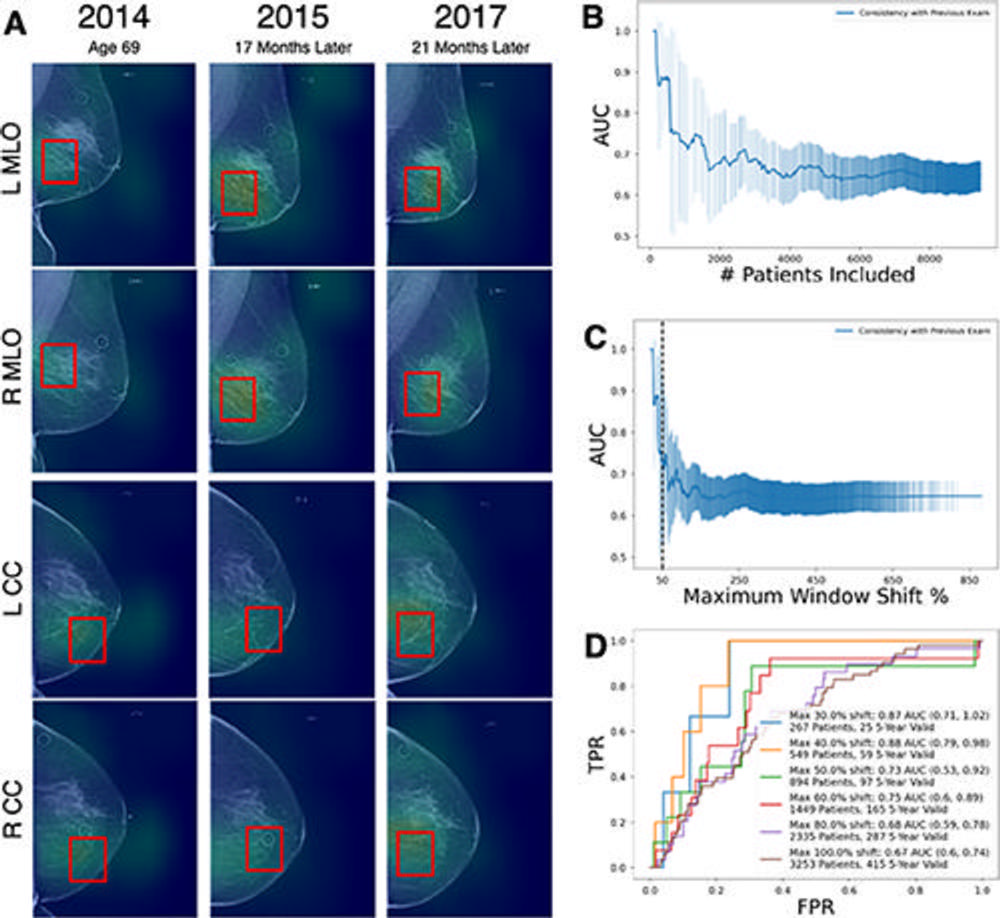
Figure 4. Prediction power of AsymMirai location consistency. (A) Full-field screening mammograms obtained at three time points in a White woman. AsymMirai predicted moderate risk for developing cancer, with high location consistency across three screenings. The patient was diagnosed with ductal carcinoma in situ in 2020. The location consistency is defined in Appendix S5. Consistency is expressed as the percentage of the window shift, with a shift of 100% representing no overlap from one year to the next. The red boxes are AsymMirai’s prediction windows for each examination. (B) Graph of AsymMirai 3-year risk area under the receiver operating characteristic (ROC) curve (AUC) for patient subgroups with increasing location inconsistency. The x-axis is the number of patients included in the subgroup. Model performance is highest for patients with the highest location consistency (left part of the plot), as measured by the shift from the preceding examination’s prediction window location. The shaded areas represent the 95% CIs at each threshold. (C) Graph of AsymMirai 3-year risk AUC for patient subgroups with increasing location inconsistency. Same as in B, except for the x-axis, location consistency is expressed as the window shift percentage. The dotted vertical line indicates a window shift of 50%. (D) AsymMirai ROC curves for selected location consistency thresholds as measured by the shift from the previous prediction window location. Model performance improved for patients with high location consistency between examinations, as indicated by lower window shifts. The legend contains the number of patients with an examination satisfying each threshold followed by the number of patients with at least one 3-year valid examination from each subgroup. A 3-year valid examination can include either 3 years of negative screening follow-up or a cancer diagnosis within 3 years. CC = craniocaudal, FPR = false-positive rate, MAX = maximum, MLO = mediolateral oblique, TPR = true-positive rate.
High-res (TIF) version
(Right-click and Save As)
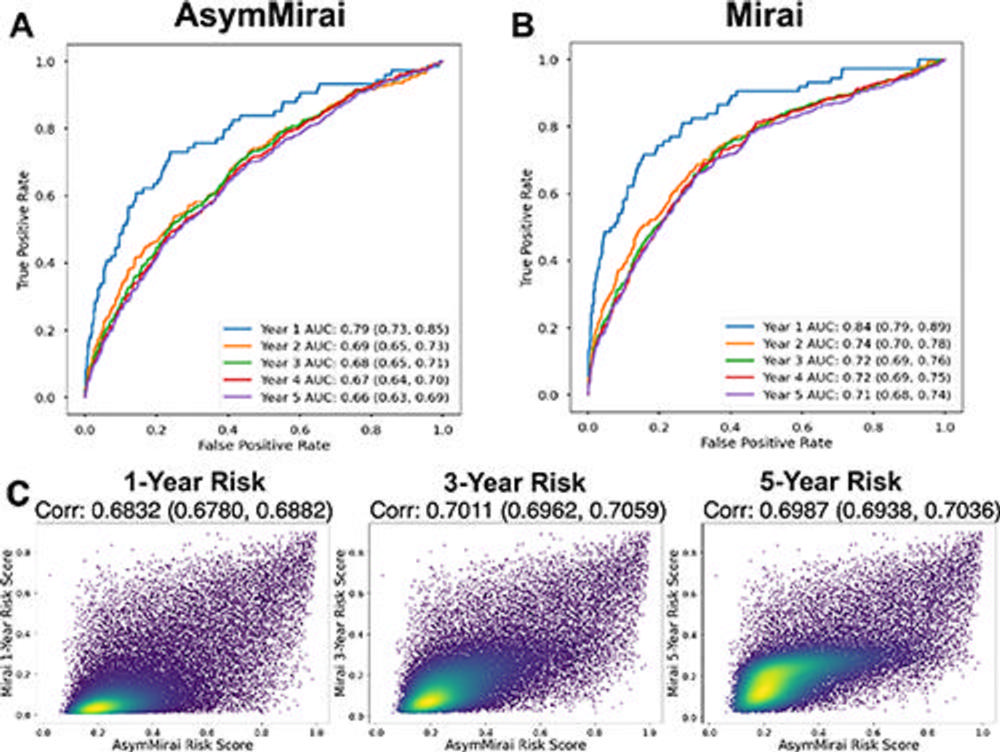
Figure 5. Comparison of the performance of Mirai and AsymMirai on EMory BrEast imaging Dataset (EMBED) validation screening mammograms. (A) AsymMirai 1–5-year breast cancer risk prediction receiver operating characteristic (ROC) curves and area under the curve (AUC) values, with 95% CIs in parentheses. (B) Mirai 1–5-year breast cancer risk prediction ROC curves and AUC values, with 95% CIs in parentheses. The AUC CIs for AsymMirai and Mirai overlap for each year. (C) Density plots show prediction correlation for AsymMirai and Mirai with 1-, 3-, and 5-year risk. The 2- and 4-year risks are omitted because the predictions are the same as those for the 3- and 5-year risks, respectively.
High-res (TIF) version
(Right-click and Save As)