Low-income Country Cardiac Imaging Procedures Remain Down Post-COVID
Released: September 21, 2023
At A Glance
- A worldwide study found that cardiovascular imaging procedure volumes in low-income countries have not returned to pre-COVID levels.
- Cardiovascular imaging volumes have greatly recovered in the U.S. and in non-U.S. high-income countries.
- The availability of telemedicine services and policies may have played a role in the recovery.
- RSNA Media Relations
1-630-590-7762
media@rsna.org - Linda Brooks
1-630-590-7738
lbrooks@rsna.org - Imani Harris
1-630-481-1009
iharris@rsna.org
OAK BROOK, Ill. (September 21, 2023) — Declines in cardiovascular procedure volumes observed early in the COVID-19 pandemic greatly recovered in 2021 in the U.S. and other high-income countries, but not in facilities in lower-income countries, according to a study published in Radiology: Cardiothoracic Imaging, a journal of the Radiological Society of North America (RSNA).

“Cardiovascular disease remains the leading cause of death for both men and women,” said lead researcher Andrew J. Einstein, M.D., Ph.D., director of nuclear cardiology, cardiac CT and MRI, and professor of medicine at Columbia University Irving Medical Center, New York. “Diagnostic procedures are imperative for the timely diagnosis and risk stratification of patients with suspected cardiovascular disease.”
Dr. Einstein and a team of researchers evaluated data collected by the International Atomic Energy Agency (IAEA) through the Non-invasive Cardiology Protocols Study of COVID-19 (INCAPS COVID and INCAPS COVID 2). The worldwide studies collected data from 669 facilities in 107 countries to determine the impact of the pandemic on diagnostic cardiovascular procedure volumes.
With 93 centers across 34 U.S. states participating, the study is one of the largest analyses of diagnostic cardiovascular procedures in the U.S. published to date.
Participating facilities reported diagnostic imaging volumes during March 2019 (baseline), April 2020 (early pandemic period), and April 2021 (recovery period).
Using the INCAPS COVID 2 data, the researchers evaluated the procedure volumes before, during and after the pandemic. The team also performed a statistical analysis on the factors associated with a return to pre-pandemic volumes in the U.S.
U.S. facilities submitted procedure volumes totaling 262,691, and non-U.S. centers submitted volumes totaling 930,235. Baseline procedure volume per center was higher for U.S. facilities compared with all non-U.S. facilities (951 versus 222) and non-U.S. high-income country (NUHIC) facilities (951 versus 300).
The worldwide volume of cardiothoracic imaging procedures decreased by 64% in April 2020 compared to March 2019. By 2021, low- and low-middle-income countries reported persistent and substantial declines in procedure volumes compared to 2019, while all other countries, including the U.S., reported procedure volumes near or at prior 2019 baseline volumes. Regional recovery in the U.S. was lowest in the South and West.
According to Dr. Einstein, the availability of telemedicine services and policies may have been one of the factors playing a role in the recovery. U.S. facilities reported a two-fold greater use of telehealth services compared with NUHIC facilities.
“Though further studies are needed to gauge the long-term impact of increased telehealth use on patient outcomes, studies have already shown that telehealth is associated with increased patient satisfaction, improved patient retention, and improved access to care for a wide range of patient populations and communities,” he said.
Dr. Einstein said a multi-faceted approach is needed to address potential excess morbidity and mortality from cardiovascular disease in economically disadvantaged regions, including strategies such as improving access to cardiovascular care including resources for diagnosis and treatment, improving healthcare worker training and increasing telehealth infrastructure.
“Cardiovascular Testing in the United States during the COVID-19 Pandemic: Volume Recovery and Worldwide Comparison.” Collaborating with Dr. Einstein were Cole B. Hirschfeld, M.D., Sharmila Dorbala, M.D., M.P.H., Leslee J. Shaw, Ph.D., Todd C. Villines, M.D., Andrew D. Choi, M.D., Nathan Better, M.B.B.S., Rodrigo J. Cerci, M.D., Ganesan Karthikeyan, M.D., M.B.B.S., D.M., M.Sc., Joao V. Vitola, M.D., Ph.D., Michelle C. Williams, M.B.Ch.B., Ph.D., Mouaz Al-Mallah, M.D., M.Sc., Daniel S. Berman, M.D., Adam Bernheim, M.D., Robert W. Biederman, M.D., Paco E. Bravo, M.D., Matthew J. Budoff, M.D., Renee P. Bullock-Palmer, M.D., Marcus Y. Chen, M.D., Michael P. DiLorenzo, M.D., M.S.C.E., Rami Doukky, M.D., M.Sc., M.B.A., Maros Ferencik, M.D., Ph.D., Jeffrey B. Geske, M.D., Fadi G. Hage, M.D., Robert C. Hendel, M.D., Lynne Koweek, M.D., Venkatesh L. Murthy, M.D., Ph.D., Jagat Narula, M.D., Ph.D., Patricia F. Rodriguez Lozano, M.D., Nishant R. Shah, M.D., M.P.H., Amee Shah, M.D., Prem Soman, M.D., Ph.D., Randall C. Thompson, M.D., David Wolinsky, M.D., Yosef A. Cohen, B.A., Eli Malkovskiy, B.A., Michael J. Randazzo, M.D., Juan Lopez-Mattei, M.D., Purvi Parwani, M.B.B.S., M.P.H., Mrinali Shetty, M.D., Thomas N. B. Pascual, M.D., M.Sc., M.H.P.Ed., Yaroslav Pynda, M.Sc., Maurizio Dondi, M.D., Ph.D., and Diana Paez, M.D., M.Ed., on behalf of the INCAPS COVID 2 Investigators Group.
Radiology: Cardiothoracic Imaging is edited by Suhny Abbara, M.D., University of Texas Southwestern Medical Center, Dallas, and owned and published by the Radiological Society of North America, Inc.(https://pubs.rsna.org/journal/cardiothoracic)
RSNA is an association of radiologists, radiation oncologists, medical physicists and related scientists promoting excellence in patient care and health care delivery through education, research, and technologic innovation. The Society is based in Oak Brook, Illinois. (RSNA.org)
For patient-friendly information on cardiac imaging, visit RadiologyInfo.org.
Images (JPG, TIF):
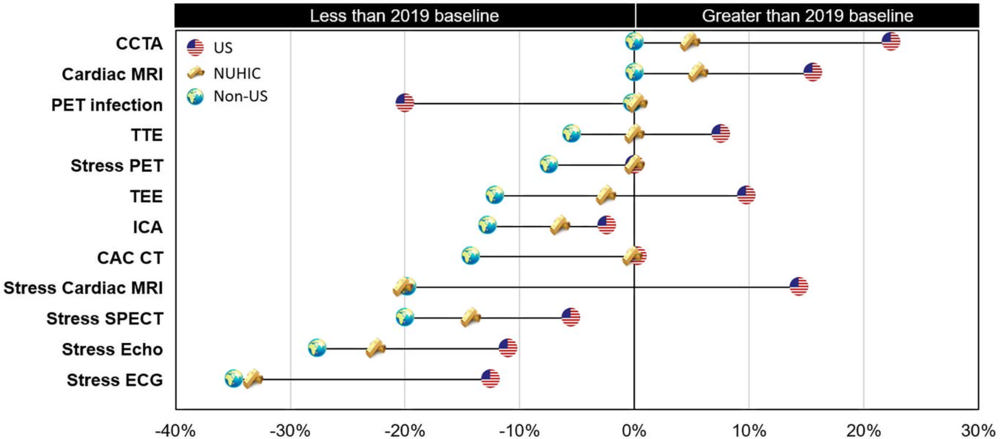
Figure 1. Change in diagnostic cardiovascular testing in 2021 compared with prepandemic procedure baseline volumes. Chart compares the median percentage change in procedure volumes of U.S. (represented by U.S. flag), NUHIC (represented by gold bars), and all non-U.S. (represented by world globe) facilities from March 2019 to April 2021. Percentage change represents the median of the percentage change values of all individual facilities in each category. Procedure types on the vertical axis are shown in descending order of percentage change for all non-U.S. facilities. CAC = coronary artery calcium, CCTA = coronary CT angiography, ECG = electrocardiography, Echo = echocardiography, ICA = invasive coronary angiography, NUHIC = non-U.S. high-income country, TEE = transesophageal echocardiography, TTE = transthoracic echocardiography.
High-res (TIF) version
(Right-click and Save As)
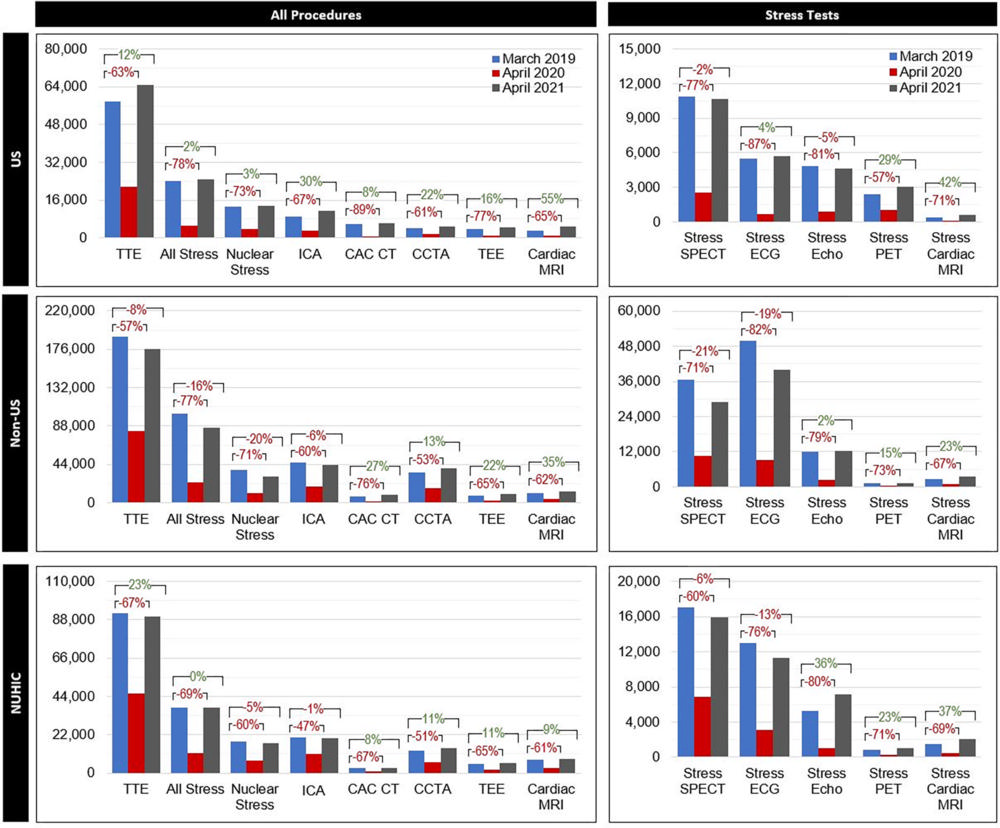
Figure 2. Change in total procedure volumes by procedure type. Clustered bar graphs show the total procedure volumes for March 2019 (blue), April 2020 (red), and April 2021 (gray) by procedure type for U.S., non-U.S., and NUHIC facilities. Percentage change values represent the change in total summed procedures of all individual facilities in each category (in contrast to the median of the individual percentage change values shown in the central illustration) from 2019 to 2020 (bottom bracket) and 2019 to 2021 (top bracket). Nuclear stress testing includes stress SPECT and stress PET. PET infection testing is not shown in the figure because of the small sample size. CAC = coronary artery calcium, CCTA = coronary CT angiography, ECG = electrocardiography, Echo = echocardiography, ICA = invasive coronary angiography, NUHIC = non-U.S. high-income country, TEE = transesophageal echocardiography, TTE = transthoracic echocardiography.
High-res (TIF) version
(Right-click and Save As)
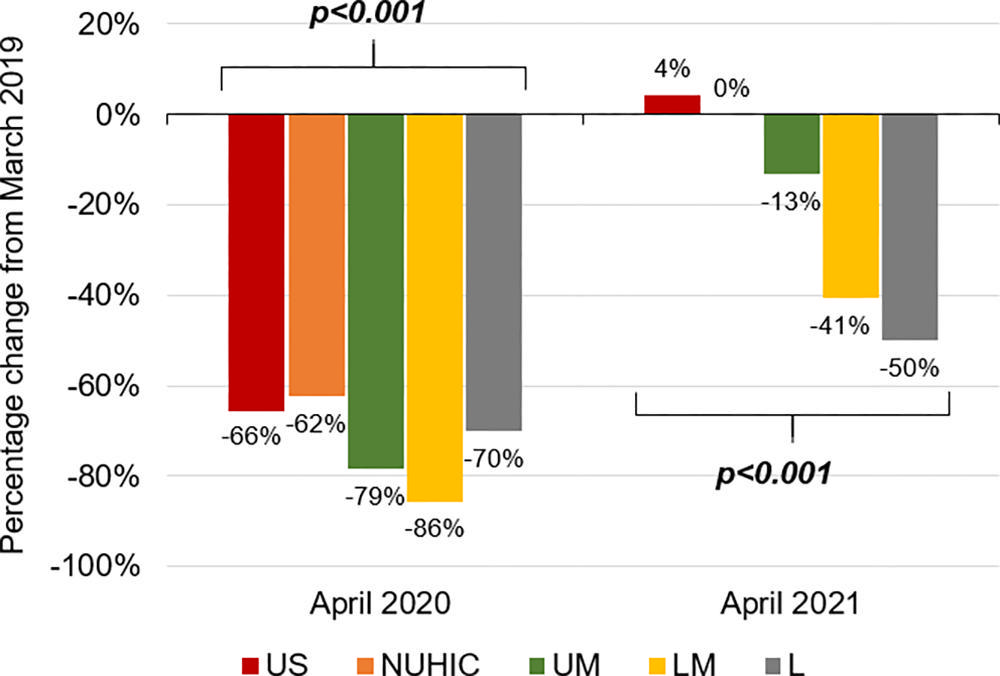
Figure 3. Median reduction and return to baseline of procedure volumes by country income level. Clustered bar chart shows the median percentage change in diagnostic cardiovascular procedure volumes in April 2020 (left) and April 2021 (right) compared with prepandemic baseline by country income level. Facilities in lower-middle-income countries (LM) and low-income countries (L) reported significantly lower recovery of procedure volumes in 2021 compared with facilities in upper-middle-income countries (UM), NUHIC, and the United States, which reported volumes near or at 2019 baselines. Percentage change was calculated as the median value of the percentage change of all individual facilities in each category. NUHIC = non-U.S. high income countries.
High-res (TIF) version
(Right-click and Save As)
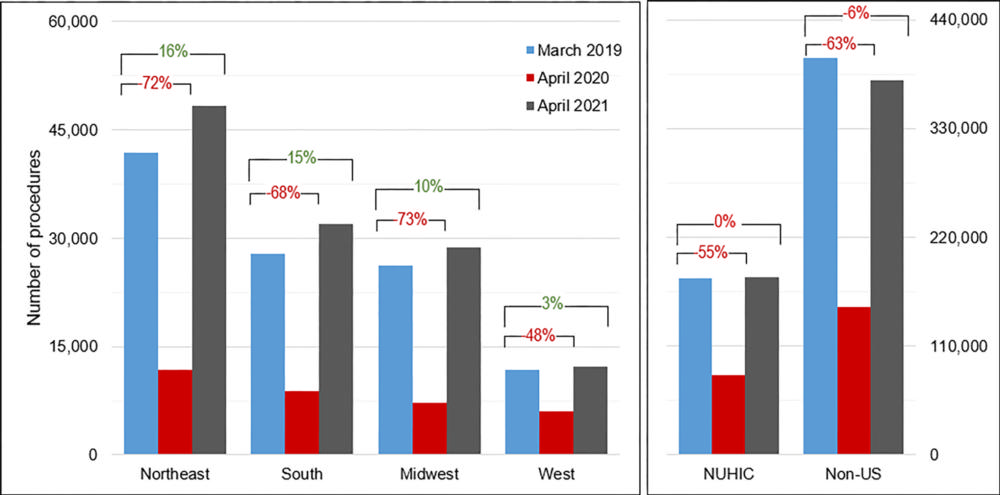
Figure 4. Change in total cardiovascular procedure volumes by U.S. region, NUHIC, and all non-U.S. centers. The percentage change values represent the change in total summed procedures of all individual facilities from 2019 to 2020 (bottom bracket) and 2019 to 2021 (top bracket). NUHIC = non-U.S. high income countries.
High-res (TIF) version
(Right-click and Save As)