Radiologists Outperformed AI in Identifying Lung Diseases on Chest X-ray
Released: September 26, 2023
At A Glance
- Researchers compared the performance of four commercially available AI tools with that of a pool of 72 radiologists interpreting 2,040 adult chest X-rays.
- Although, in general, radiologists and AI had a similar rate of missed findings, AI tools produced more false-positive results.
- Most previous studies have evaluated the disease detection ability of AI in simple cases with presence or absence of a single disease, which is easier than real-life scenarios where multiple diseases may be present.
- RSNA Media Relations
1-630-590-7762
media@rsna.org - Linda Brooks
1-630-590-7738
lbrooks@rsna.org - Imani Harris
1-630-481-1009
iharris@rsna.org
OAK BROOK, Ill. — In a study of more than 2,000 chest X-rays, radiologists outperformed AI in accurately identifying the presence and absence of three common lung diseases, according to a study published in Radiology, a journal of the Radiological Society of North America (RSNA).

“Chest radiography is a common diagnostic tool, but significant training and experience is required to interpret exams correctly,” said lead researcher Louis L. Plesner, M.D., resident radiologist and Ph.D. fellow in the Department of Radiology at Herlev and Gentofte Hospital in Copenhagen, Denmark.
While commercially available and FDA-approved AI tools are available to assist radiologists, Dr. Plesner said the clinical use of deep-learning-based AI tools for radiological diagnosis is in its infancy.
“While AI tools are increasingly being approved for use in radiological departments, there is an unmet need to further test them in real-life clinical scenarios,” Dr. Plesner said. “AI tools can assist radiologists in interpreting chest X-rays, but their real-life diagnostic accuracy remains unclear.”
Dr. Plesner and a team of researchers compared the performance of four commercially available AI tools with a pool of 72 radiologists in interpreting 2,040 consecutive adult chest X-rays taken over a two-year period at four Danish hospitals in 2020. The median age of the patient group was 72 years. Of the sample chest X-rays, 669 (32.8%) had at least one target finding.
The chest X-rays were assessed for three common findings: airspace disease (a chest X-ray pattern, for example, caused by pneumonia or lung edema), pneumothorax (collapsed lung) and pleural effusion (a buildup of water around the lungs).
AI tools achieved sensitivity rates ranging from 72 to 91% for airspace disease, 63 to 90% for pneumothorax, and 62 to 95% for pleural effusion.
“The AI tools showed moderate to a high sensitivity comparable to radiologists for detecting airspace disease, pneumothorax and pleural effusion on chest X-rays,” he said. “However, they produced more false-positive results (predicting disease when none was present) than the radiologists, and their performance decreased when multiple findings were present and for smaller targets.”
For pneumothorax, positive predictive values—the probability that patients with a positive screening test truly have the disease—for the AI systems ranged between 56 and 86%, compared to 96% for the radiologists.
“AI performed worst at identifying airspace disease, with positive predictive values ranging between 40 and 50%,” Dr. Plesner said. “In this difficult and elderly patient sample, the AI predicted airspace disease where none was present five to six out of 10 times. You cannot have an AI system working on its own at that rate.”
According to Dr. Plesner, the goal of radiologists is to balance the ability of finding and excluding disease, avoiding both significant overlooked diseases and overdiagnosis.
“AI systems seem very good at finding disease, but they aren’t as good as radiologists at identifying the absence of disease especially when the chest X-rays are complex” he said. “Too many false-positive diagnoses would result in unnecessary imaging, radiation exposure and increased costs.”
Dr. Plesner said most studies generally tend to evaluate the ability of AI to determine the presence or absence of a single disease, which is a much easier task than real-life scenarios where patients often present with multiple diseases.
“In many prior studies claiming AI superiority over radiologists, the radiologists reviewed only the image without access to the patient’s clinical history and previous imaging studies,” he said. “In everyday practice, a radiologist’s interpretation of an imaging exam is a synthesis of these three data points. We speculate that the next generation of AI tools could become significantly more powerful if capable of this synthesis as well, but no such systems exist yet.”
“Our study demonstrates that radiologists generally outperform AI in real-life scenarios where there is a wide variety of patients,” he said. “While an AI system is effective at identifying normal chest X-rays, AI should not be autonomous for making diagnoses.”
Dr. Plesner noted that these AI tools could boost radiologists’ confidence in their diagnoses by providing a second look at chest X-rays.
“Commercially Available Chest Radiograph AI Tools for Detecting Airspace Disease, Pneumothorax, and Pleural Effusion.” Collaborating with Dr. Plesner were Felix C. Müller, M.D., Ph.D., Mathias W. Brejnebøl, M.D., Lene C. Laustrup, M.D., Finn Rasmussen, M.D., D.M.Sc., Olav W. Nielsen, M.D., Ph.D., Mikael Boesen, M.D., Ph.D., and Michael Brun Andersen, M.D., Ph.D.
In 2023, Radiology is celebrating its 100th anniversary with 12 centennial issues, highlighting Radiology’s legacy of publishing exceptional and practical science to improve patient care.
Radiology is edited by Linda Moy, M.D., New York University, New York, N.Y., and owned and published by the Radiological Society of North America, Inc. (https://pubs.rsna.org/journal/radiology)
RSNA is an association of radiologists, radiation oncologists, medical physicists and related scientists promoting excellence in patient care and health care delivery through education, research and technologic innovation. The Society is based in Oak Brook, Illinois. (RSNA.org)
For patient-friendly information on chest X-rays, visit RadiologyInfo.org.
Video (MP4):

Video. Louis L. Plesner, M.D., discusses his research on how radiologists outperformed AI in identifying lung diseases on chest X-ray.
Download MP4
(Right-click and Save As)
Images (JPG, TIF):
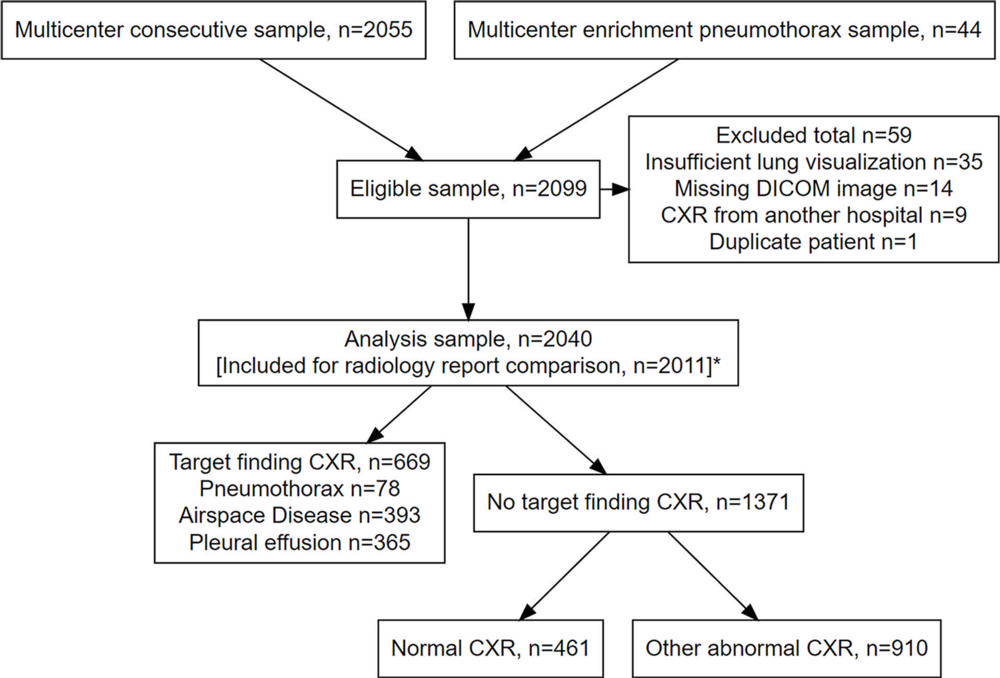
Figure 1. Flowchart shows study inclusion and exclusion. DICOM = Digital Imaging and Communications in Medicine.
High-res (TIF) version
(Right-click and Save As)
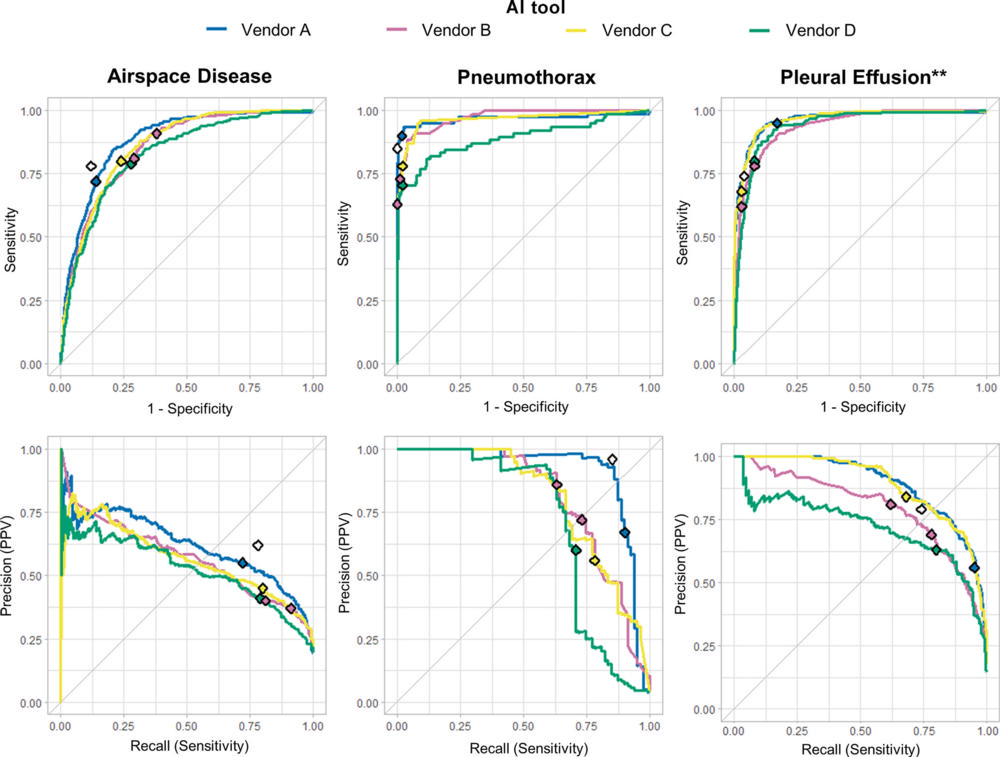
Figure 2. Diagnostic accuracy of four artificial intelligence (AI) tools for detection of airspace disease, pneumothorax, and pleural effusion as target findings. Top: Receiver operating curves show performance of the AI tools for detecting the target findings on chest radiographs. Bottom: Precision recall curves show performance for the same target findings. Colored diamonds mark the operating point thresholds set by the manufacturer and used in this study, while white diamonds represent clinical radiology report performance (n = 2011). ** = The vendor D AI tool does not detect pleural effusion on anteroposterior chest radiographs, thus the green line in these graphs represent posteroanterior chest radiographs only (n = 1564). PPV = positive predictive value.
High-res (TIF) version
(Right-click and Save As)
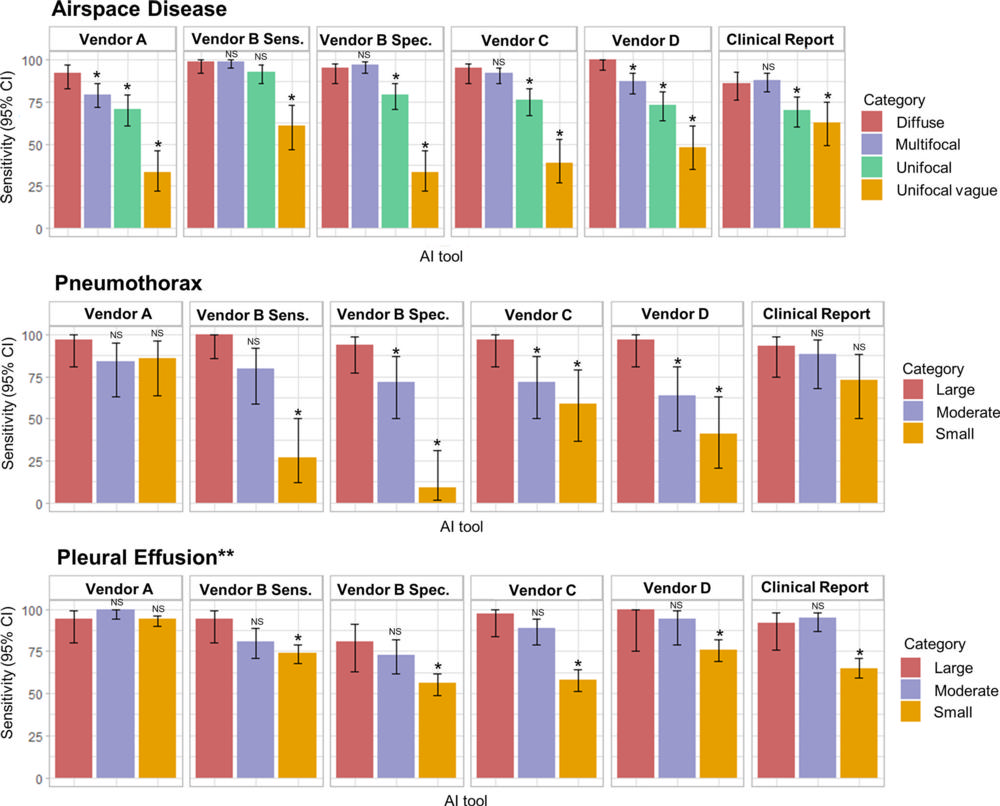
Figure 3. Sensitivity of artificial intelligence (AI) tools and clinical radiology reports stratified according to target finding. Top: Bar graphs show airspace disease findings (n = 393). Middle: Bar graphs show pneumothorax findings ( n = 78). Bottom: Bar graphs show pleural effusion findings (n = 365). NS = not significant.
High-res (TIF) version
(Right-click and Save As)
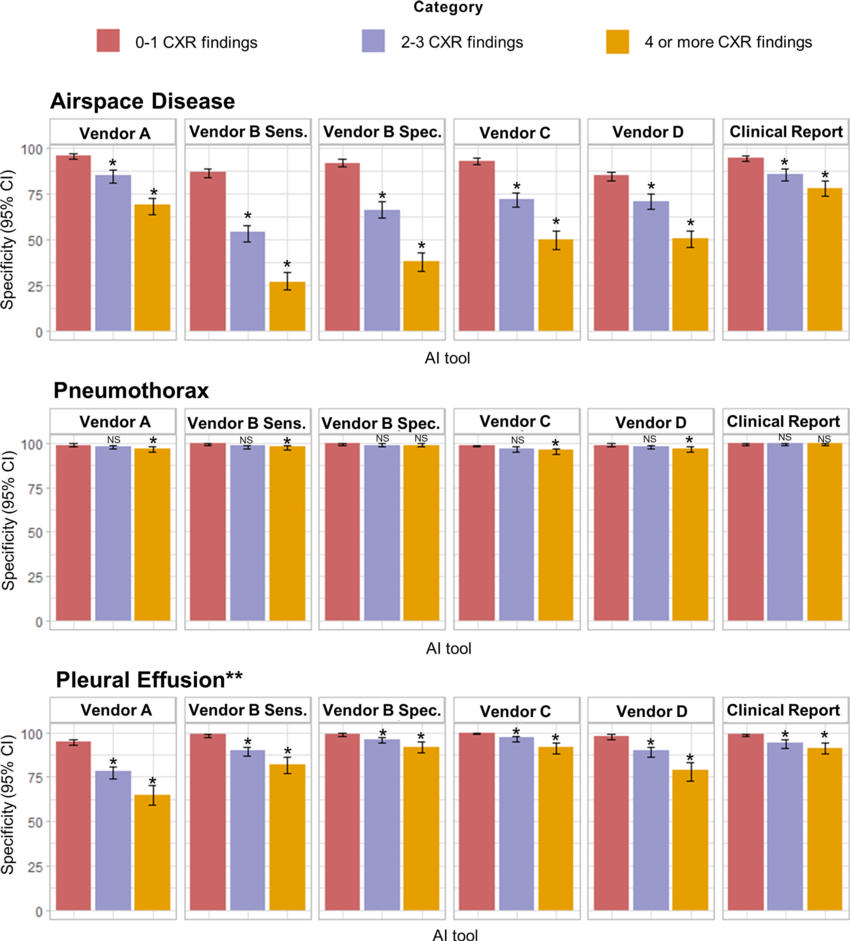
Figure 4. Specificity of artificial intelligence (AI) tools and clinical radiology reports stratified according to the number of concurrent findings on chest radiographs. Top: Bar graphs show airspace disease controls grouped into 0–1 ( n = 772), 2–3 ( n = 454), and 4 or more ( n = 421) chest radiograph findings, with the lowest specificity values in the 4 or more category. Middle: Bar graphs show pneumothorax controls grouped into 0–1 ( n = 814), 2–3 ( n = 548), and 4 or more ( n = 600) chest radiograph findings, with lowest values in the 4 or more category. Bottom: Bar graphs show pleural effusion controls grouped into 0–1 ( n = 812), 2–3 ( n = 510), and 4 or more ( n = 353) chest radiograph findings, with the lowest values in the 4 or more category. Vendor B used both high sensitivity (Vendor B Sens.) and high specificity (Vendor B Spec.) probability thresholds. * = A statistically significant difference is indicated with reference to the bar illustrating the highest sensitivity for the individual AI tool (not across different AI tools), as calculated using the Fisher exact test. ** = The vendor D AI tool does not detect pleural effusion in anteroposterior chest radiographs, thus the graph illustrates results for posteroanterior only ( n = 1564) and should not be directly compared with other vendors. All data are provided in Table S5. NS = not significant.
High-res (TIF) version
(Right-click and Save As)
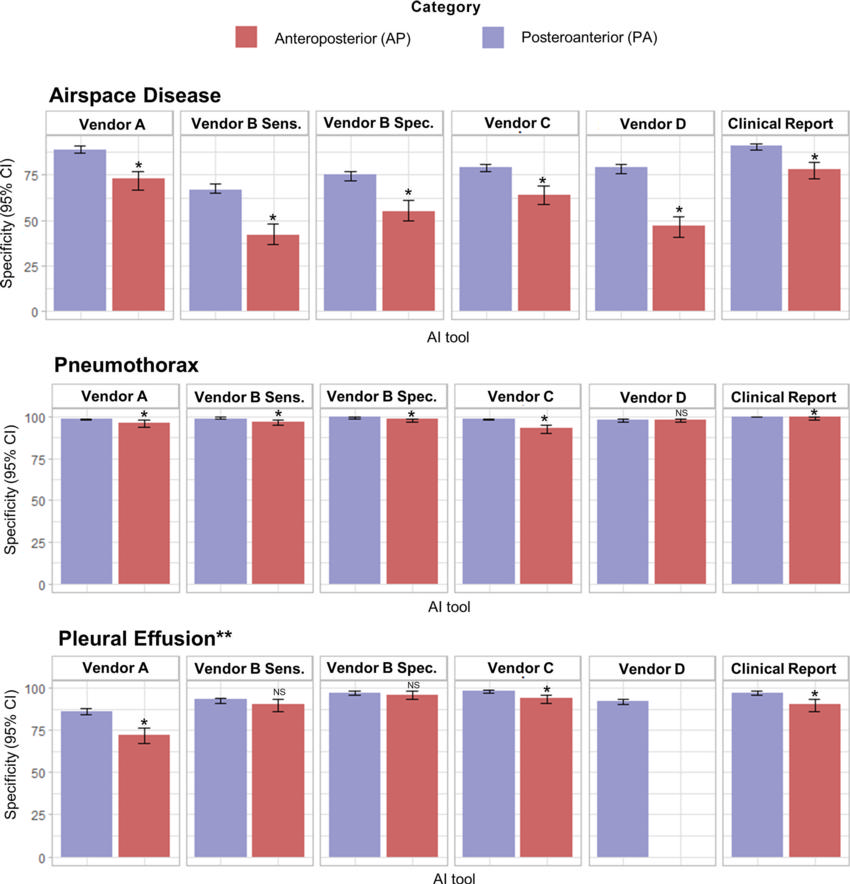
Figure 5. Specificity of artificial intelligence (AI) tools and clinical radiology reports stratified according to radiographic projection. Top: Bar graphs show airspace disease controls grouped into anteroposterior (AP, n = 318) and posteroanterior (PA, n = 1329), with the lowest values in the anteroposterior projection. Middle: Bar graphs show pneumothorax controls grouped into anteroposterior ( n = 466) and posteroanterior ( n = 1496), with the lowest values in the anteroposterior projection. Bottom: Bar graphs show pleural effusion controls grouped into anteroposterior ( n = 340) and posteroanterior ( n = 1335), with the lowest values in the anteroposterior projection for vendors A and C and the proportion unchanged for vendor B at both the high sensitivity (Vendor B Sens.) and high specificity (Vendor B Spec.) thresholds (P = .09 and P = .29). * = A statistically significant difference (P < .05) is indicated with reference to the bar illustrating the highest sensitivity for the individual AI tool (not across different AI tools), as calculated using the Fisher exact test. ** = The vendor D AI tool does not detect pleural effusion in anteroposterior chest radiographs, thus the graph illustrates results for posteroanterior only ( n = 1564). Data used to generate this figure are provided in Table S5. NS = not significant.
High-res (TIF) version
(Right-click and Save As)
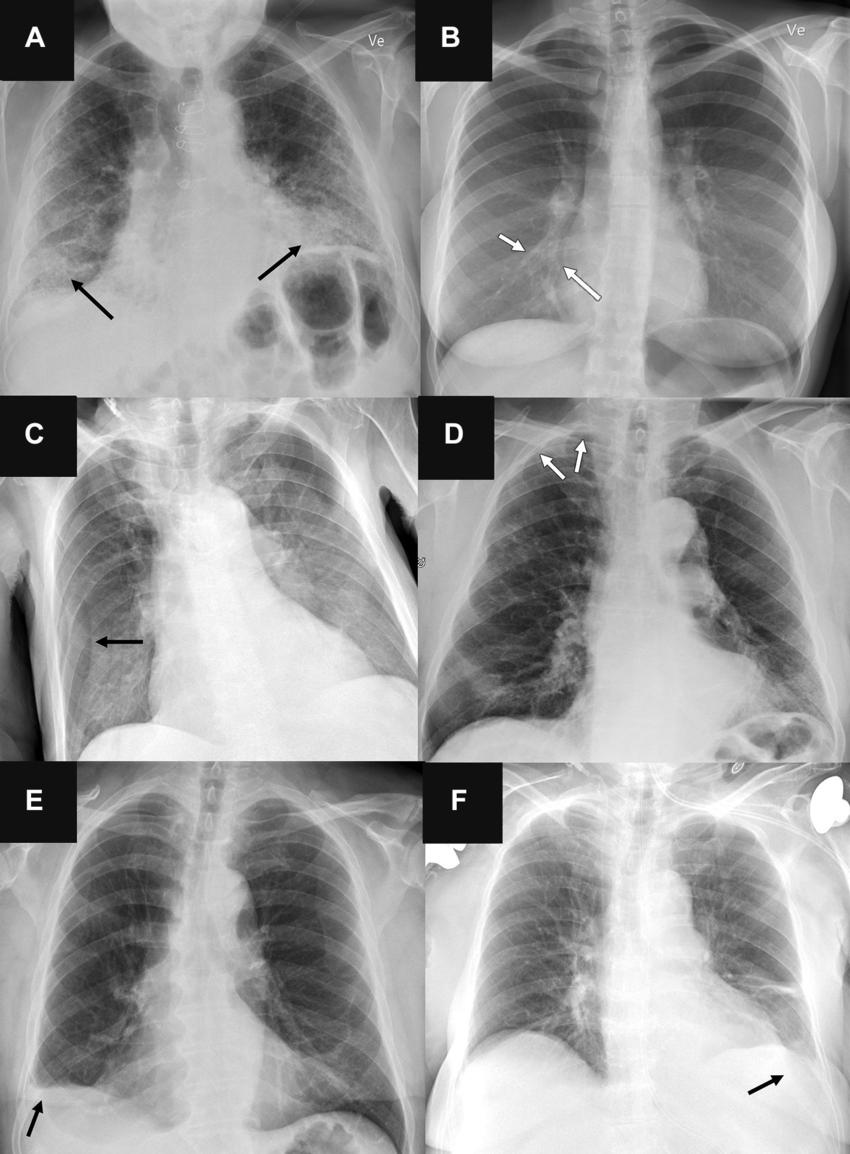
Figure 6. Representative chest radiographs in six patients show (A, C, E) false-positive findings and (B, D, F) false-negative findings as identified by the artificial intelligence (AI) tools. These examples were all correctly classified by the clinical radiology reports. (A) Posteroanterior chest radiograph in a 71-year-old male patient who underwent examination due to progression of dyspnea shows bilateral fibrosis (arrows), which was misclassified as airspace disease by all four AI tools. (B) Posteroanterior chest radiograph in a 31-year-old female patient referred for radiography due to month-long coughing shows subtle airspace opacity at the right cardiac border (arrows), which was missed by all AI tools. (C) Anteroposterior chest radiograph in a 78-year-old male patient referred after placement of a central venous catheter shows a skin fold on the right side (arrow), which was misclassified as pneumothorax by all AI tools. (D) Posteroanterior chest radiograph in a 78-year-old male patient referred to rule out pneumothorax shows very subtle apical right-sided pneumothorax (arrows), which was missed by all AI tools except for vendor B (with the high sensitivity threshold). (E) Posteroanterior chest radiograph in a 72-year-old male patient referred for radiography without a specified reason shows chronic rounding of the costophrenic angle (arrow), which was mistaken for pleural effusion by all AI tools and verified according to the reference standard in a corresponding chest CT image. (F) Anteroposterior chest radiograph in a 76-year-old female patient referred for radiography due to suspicion of congestion and/or pneumonia shows a very subtle left-sided pleural effusion (arrow), which was missed by all three AI tools that were capable of analyzing anteroposterior chest radiographs for pleural effusion.
High-res (TIF) version
(Right-click and Save As)