Radiologists Must Monitor Novel Alzheimer’s Treatment Side Effect
Released: August 31, 2023
- RSNA Media Relations
1-630-590-7762
media@rsna.org - Linda Brooks
1-630-590-7738
lbrooks@rsna.org - Imani Harris
1-630-481-1009
iharris@rsna.org
OAK BROOK, Ill. (August 31, 2023) — A new article published in RadioGraphics, a journal of the Radiological Society of North America (RSNA), examines the use of monoclonal antibody therapies for treating Alzheimer disease and alerts physicians to be on the lookout for a potential side effect: amyloid-related imaging abnormalities (ARIA).

Alzheimer disease is a progressive, irreversible brain disorder that slowly degrades memory and cognitive function. It is the most common form of dementia worldwide. While previous treatment methods focused on addressing Alzheimer disease symptoms, recent approvals of monoclonal antibodies have provided a path to target the underlying disease itself.
The main pathologic feature of Alzheimer disease is a buildup of toxic amyloid-B. Disease-modifying drugs like monoclonal antibodies work by clearing toxic amyloid-B protein from the brain. In June 2021, the U.S. Food and Drug Administration (FDA) gave accelerated approval for aducanumab (Aduhelm) as a treatment for Alzheimer disease. The FDA has determined that there is substantial evidence that aducanumab reduces amyloid-B plaques in the brain and that the reduction in these plaques is likely to result in benefits to patients.
“FDA-approved drugs such as aducanumab, as well as upcoming newer-generation drugs, have provided an exciting new therapy focused on reducing the amyloid plaque burden in Alzheimer disease,” said Amit K. Agarwal, M.B.B.S., M.D., lead author of the article and neuroradiologist at Mayo Clinic in Jacksonville, Florida.
Although this groundbreaking new therapy has shown benefits in Alzheimer’s patients, it is not without complications. Increased use of monoclonal antibodies led to the discovery of amyloid-related imaging abnormalities (ARIA). The abnormalities have been further classified into two categories, ARIA-E, representing edema (swelling) and/or effusion, and ARIA-H, representing hemorrhage. ARIA is thought to be caused by increased vascular permeability following an inflammatory response, leading to the leakage of blood products and fluid into surrounding tissues.
Patients with ARIA sometimes have headaches, but they are usually asymptomatic and only diagnosable with MRI.
“It is essential for the radiologist to recognize and monitor ARIA,” Dr. Agarwal said. “As the use of monoclonal antibodies becomes more widespread, close collaboration between neurologists and radiologists is needed before and during therapy to plan for image monitoring per established guidelines.”
ARIA-E is the most common side effect of monoclonal antibody treatment. In two phase III trials, 35% of patients on the approved dose had ARIA-E. These trials also showed that most ARIA-E cases were clinically asymptomatic and that 98% were resolved at follow-up imaging. ARIA-E occurred most frequently between three and six months of treatment, with incidence sharply dropping after the first nine months. ARIA-H typically occurs in about 15 to 20% of patients treated with monoclonal antibodies. Unlike ARIA-E, ARIA-H is not transient and does not resolve over time.
Most patients with asymptomatic ARIA meeting specific radiographic and clinical criteria may continue to receive treatment. The vast majority of patients with ARIA-E can continue therapy either with or without temporary suspension. However, in ARIA-H patients, therapy decisions depend on the severity of ARIA-H and whether it is stabilized. The detection of 10 or more new microhemorrhages requires permanent discontinuation of therapy.
“Immunotherapy is becoming more prevalent in managing dementia, and the recently approved monoclonal antibody therapy offers an exciting new frontier,” Dr. Agarwal said. “Identifying and monitoring ARIA plays a vital role in safety monitoring and management decisions in anti-amyloid monoclonal antibody trials and clinical practice.”
According to Dr. Agarwal, when ARIA is present, a conservative monitoring plan should be established with a multidisciplinary approach that includes neurologists and radiologists familiar with the clinical and imaging aspects of the condition.
“Amyloid-related Imaging Abnormalities in Alzheimer Disease Treated with Anti-Amyloid-β Therapy.” Collaborating with Dr. Agarwal were Vivek Gupta, M.D., Pavan Brahmbhatt, M.D., Amit Desai, M.D., Prasanna Vibhute, M.D., Nelly Joseph-Mathurin, Ph.D., and Girish Bathla, M.D.
RadioGraphics is edited by Christine “Cooky” Menias, M.D., Mayo Clinic, Phoenix, Arizona, and owned and published by the Radiological Society of North America, Inc. (https://pubs.rsna.org/journal/radiographics)
RSNA is an association of radiologists, radiation oncologists, medical physicists and related scientists promoting excellence in patient care and health care delivery through education, research, and technologic innovation. The Society is based in Oak Brook, Illinois. (RSNA.org)
For patient-friendly information on MRI and Alzheimer’s disease, visit RadiologyInfo.org.
Images (JPG, TIF):
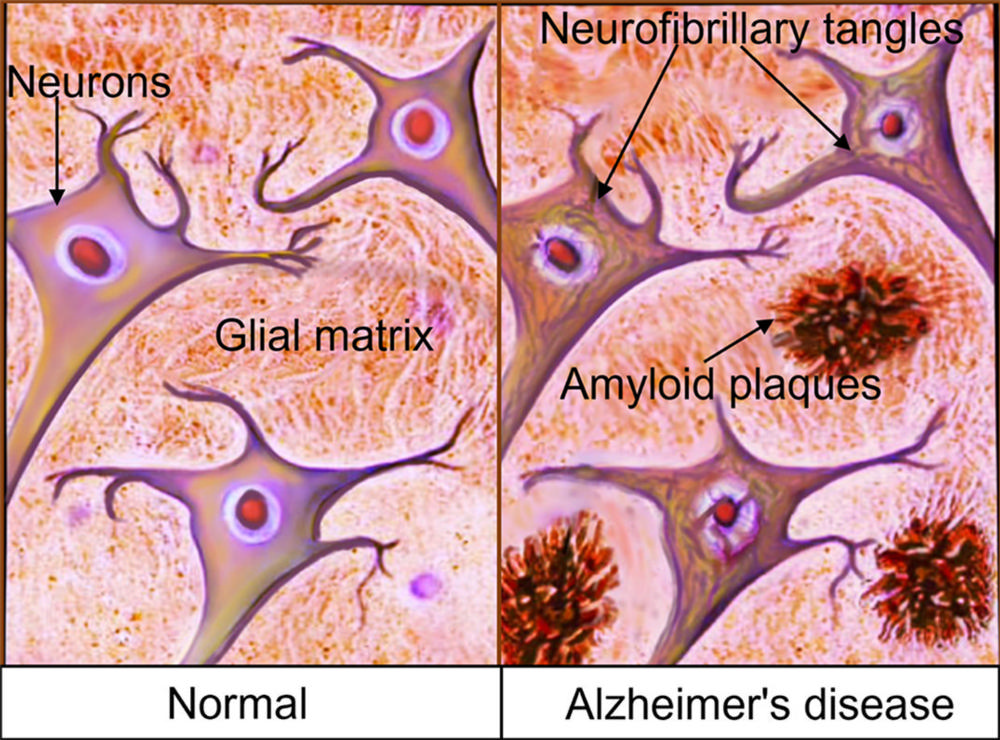
Figure 1. Primary pathophysiology of AD. The two primary lesions associated with AD are extracellular nonvascular aggregates of Aβ (senile plaques) and intraneuronal protein inclusions secondary to aggregation of misfolded and abnormally phosphorylated protein τ (neurofibrillary tangles).
High-res (TIF) version
(Right-click and Save As)
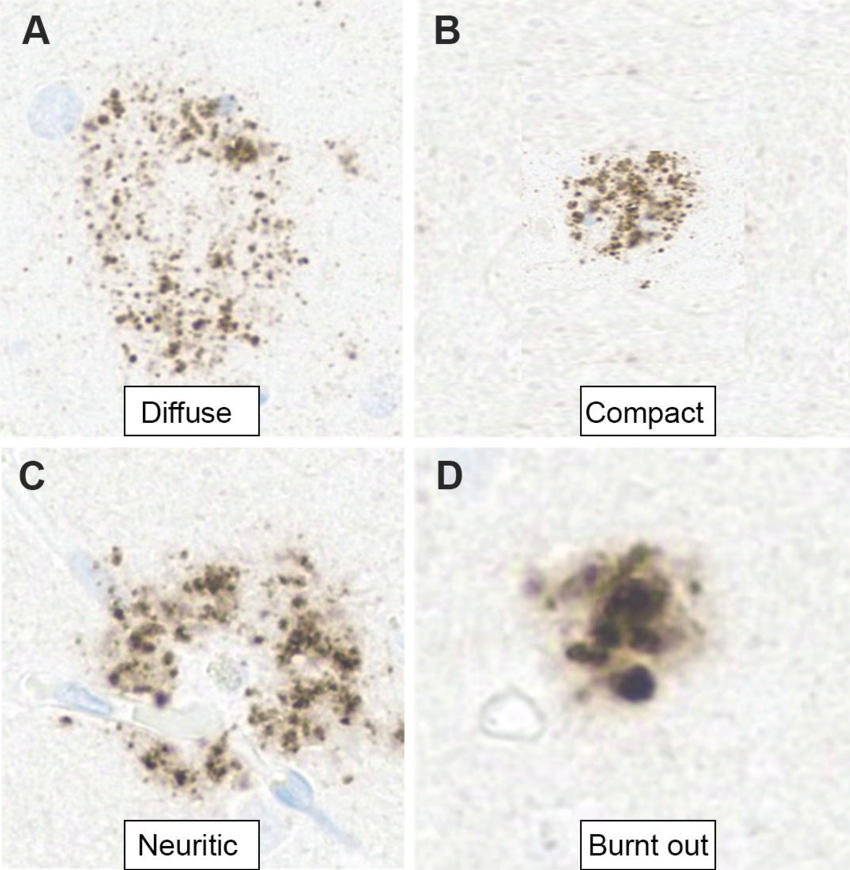
Figure 2. Photomicrographs show the evolution of Aβ plaques in AD. (A) Diffuse plaques are usually nonneuritic and not associated with glial responses or synaptic loss. (B, C) Compact (dense) plaques (B) activate the microglial cells with associated synaptic loss, eventually surrounded by dystrophic neurites known as neuritic plaques (C). (D) “Burnt-out” plaques are end-stage plaques that do not show any accompanying dystrophic neurites. Brain accumulation of even diffuse Aβ, however, initiates the AD process (cascade hypothesis), thus supporting the idea of a therapeutic intervention in the early stage of the disease. (Aβ immunohistochemistry stain; 10 μm.)
High-res (TIF) version
(Right-click and Save As)
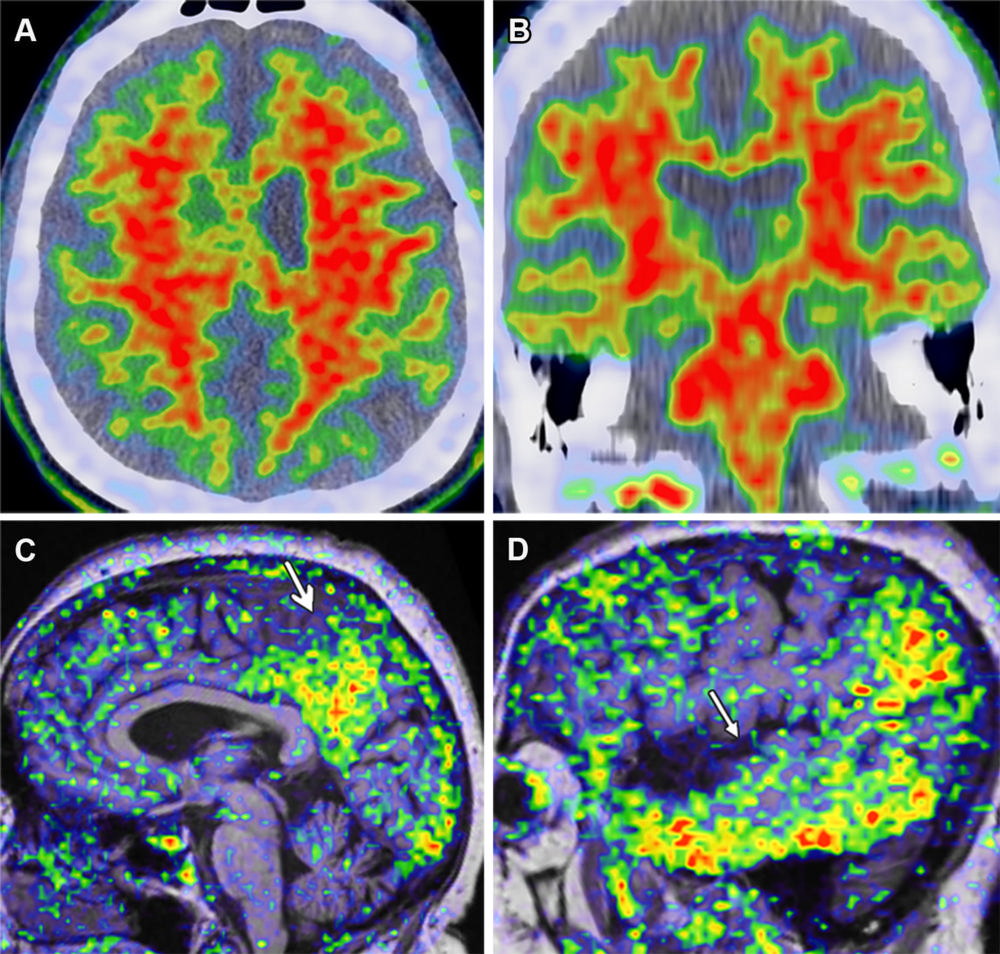
Figure 3. Amyloid and τ PET imaging in AD in a 72-year-old man with AD dementia. (A, B) Axial (A) and coronal (B) PET/CT amyloid images (tracer: florbetapir) show extensive diffuse uptake in the bilateral frontoparietal and temporal lobes. (C, D) Midsagittal (C) and lateral sagittal (D) MRI/PET τ images (tracer: AV-1451) show moderate uptake (arrow) in the temporoparietal lobe including the precuneus and posterior cingulate, representing τ deposits. Although overlap between the τ and amyloid tracers is present, abundant uptake is seen in the lateral temporal lobes with the τ ligand but not with the amyloid ligand.
High-res (TIF) version
(Right-click and Save As)
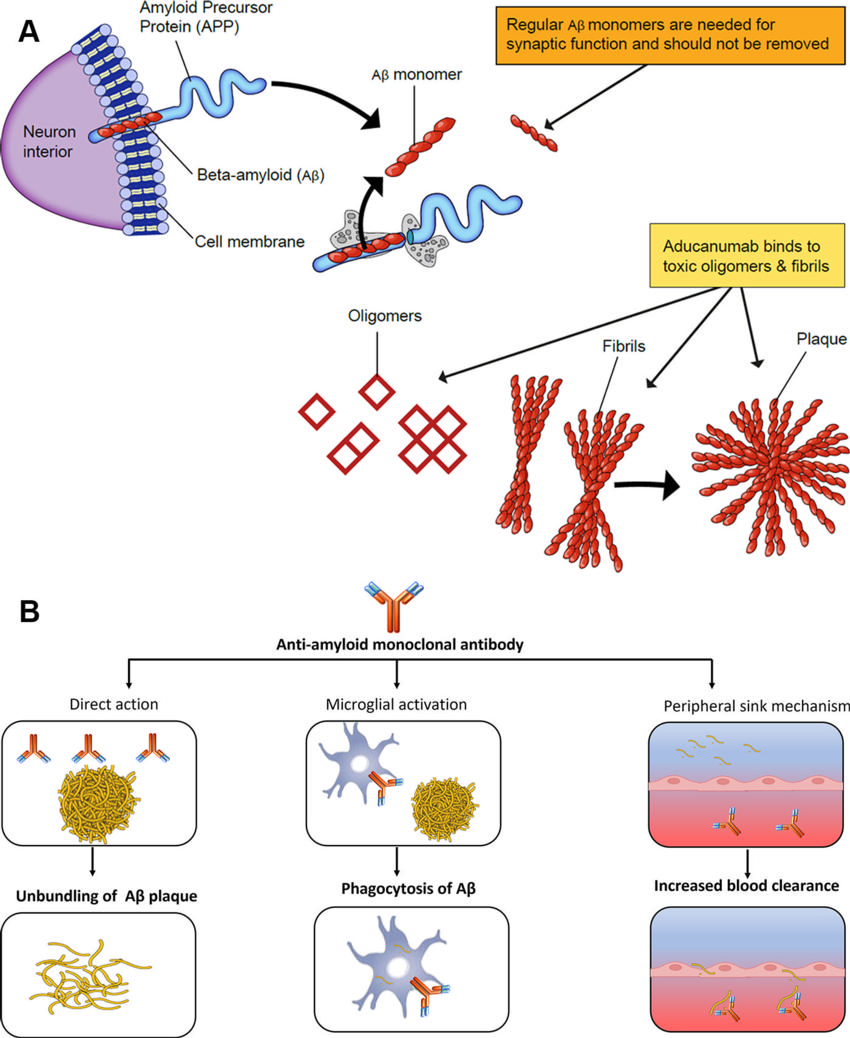
Figure 4. Mechanism of action of aducanumab (antiamyloid MAB). Aβ monomers are needed for regular synaptic functions. However, the oligomers and fibrils set off a cascade chain reaction resulting in neuronal loss and are the primary targets of aducanumab (A). This includes direct action on the amyloid plaque with unbundling, activation of microglial-induced phagocytosis, and increased blood clearance (B).
High-res (TIF) version
(Right-click and Save As)
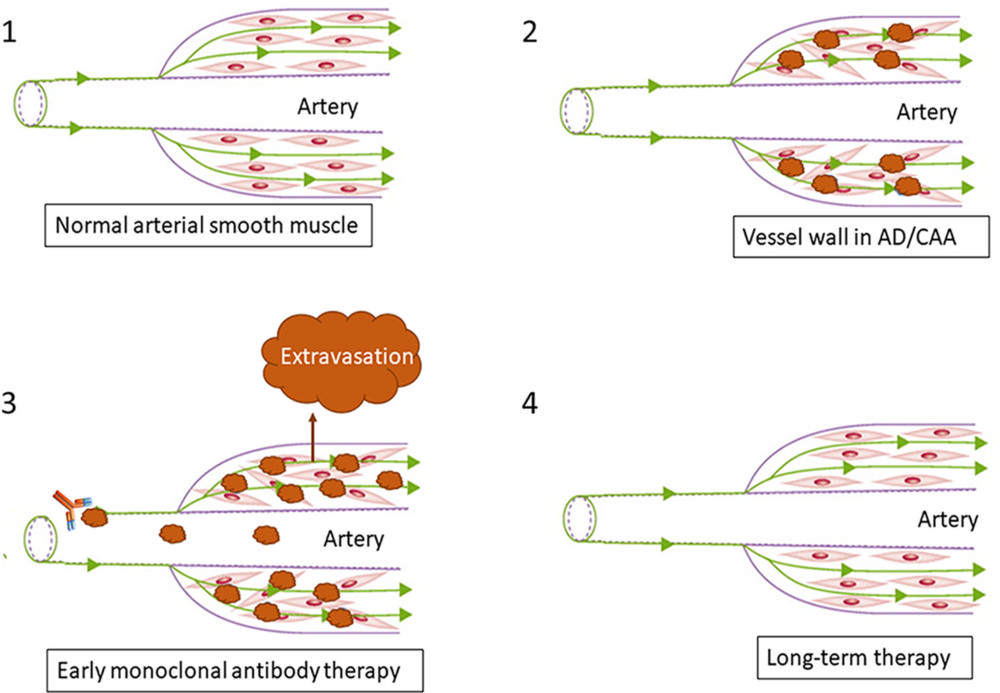
Figure 5. Pathophysiology of ARIA. Increased parenchymal Aβ accumulation with reduced perivascular clearance along with Aβ deposition within the vessel wall is seen in AD and CAA, resulting in disruption of arterial smooth muscle (1, 2). After anti-Aβ therapy initiation, vessels with preexisting amyloid vascular pathologic conditions become more susceptible to vascular extravasation events, resulting in ARIA-E (leakage of proteinaceous fluid) and ARIA-H (leakage of blood products) (3). Long-term therapy results in clearance of vessel wall amyloid buildup with reorganization of arterial smooth muscle (4).
High-res (TIF) version
(Right-click and Save As)
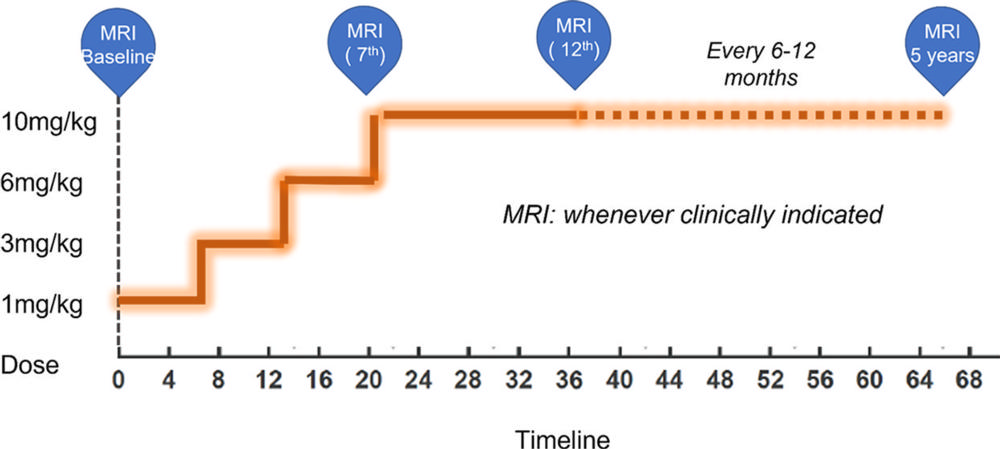
Figure 6. Dose titration chart and timeline (in weeks) for ARIA monitoring MRI. Current guidelines recommend starting at a low dose of 1 mg/kg for the first two infusions, moving to 3 mg/kg for the third and fourth infusions, 6 mg/kg for the fifth and sixth infusions, and finally to the optimum target dosage of 10 mg/kg from beyond the seventh infusion, usually achieved over a period of 20–24 weeks. MRI should be performed within 12 months before initiation of therapy and before the seventh (10 mg/kg dose) and 12th infusions for aducanumab, for up to 5 years. For ApoE4 carriers, it is recommended to undergo MRI at the fifth (6 mg/kg), seventh (10 mg/kg), 10th, and 12th infusions. MRI should also be performed for any new signs or symptoms suggestive of ARIA or any other clinical indication.
High-res (TIF) version
(Right-click and Save As)
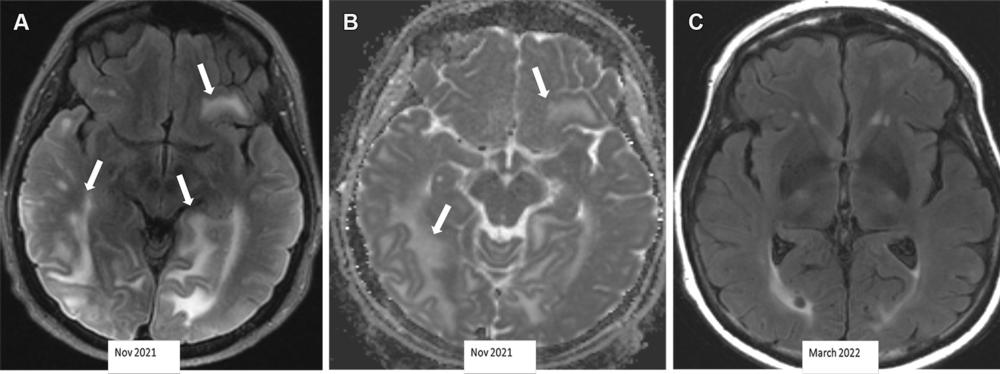
Figure 7. Severe ARIA-E (edema) in a 69-year-old woman receiving aducanumab therapy for AD with headaches and word-finding difficulty. (A, B) Axial MR images of the brain show multifocal subcortical edema (arrows) with FLAIR hyperintensity (A) and increased diffusion on the apparent diffusion coefficient (ADC) map (B), with a few areas measuring more than 10 cm. (C) Axial follow-up MR image 4 months later shows near-complete resolution of signal intensity changes. ARIA-E is most common in the occipital lobes (as in this case) and mimics posterior reversible encephalopathy syndrome (PRES) at imaging.
High-res (TIF) version
(Right-click and Save As)
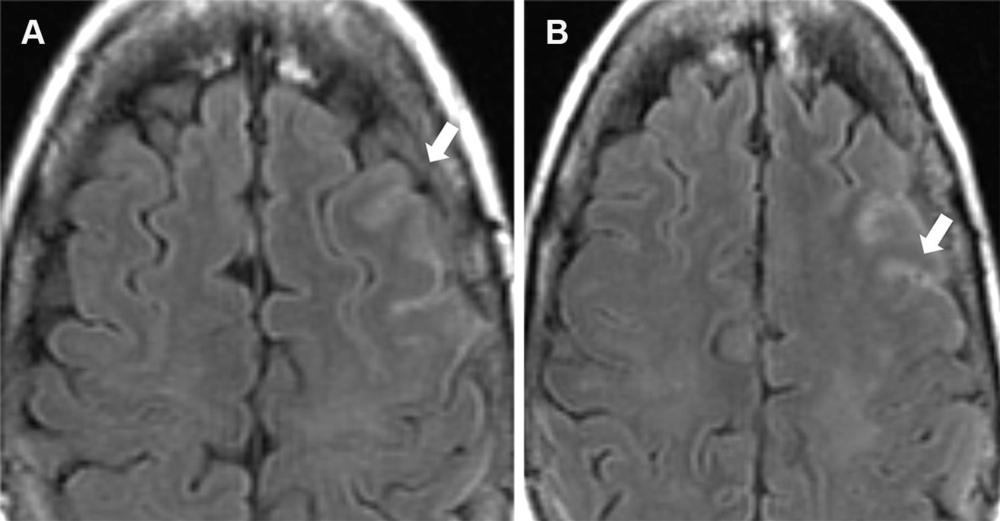
Figure 8. Mild ARIA-E (effusion) in a 62-year-old woman with mild cognitive impairment receiving aducanumab therapy. A baseline (pretreatment) MRI examination was unremarkable, and an amyloid PET examination (not shown) showed diffusely elevated amyloid. Contiguous axial FLAIR MR images obtained 9 weeks after initiation of therapy show sulcal hyperintensity (arrow) consistent with mild ARIA-E, and therapy was continued. Findings were stable at follow-up MRI after 1 month, with complete resolution after 3 months.
High-res (TIF) version
(Right-click and Save As)
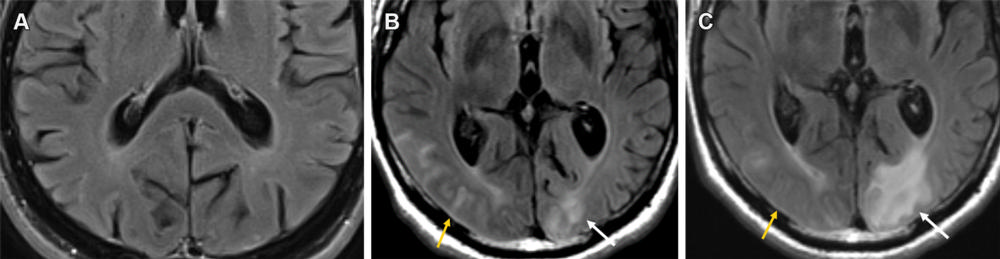
Figure 9. Mild ARIA-E (edema and effusion) in a 61-year-old man receiving aducanumab therapy. (A, B) Baseline pretreatment axial MR image (A) is unremarkable, with development of effusion (B) in the right occipital lobe (yellow arrow) and edema in the left occipital lobe (white arrow) on an axial MR image obtained 3 weeks after the target dose infusion (10 mg/kg). (C) Follow-up MR image after the fourth round of infusion shows near-complete resolution of the right occipital effusion (yellow arrow) with worsening of the left occipital lobe edema (white arrow). This was graded as mild throughout and therapy was continued, with complete resolution of all imaging changes at the seventh-week MRI examination.
High-res (TIF) version
(Right-click and Save As)
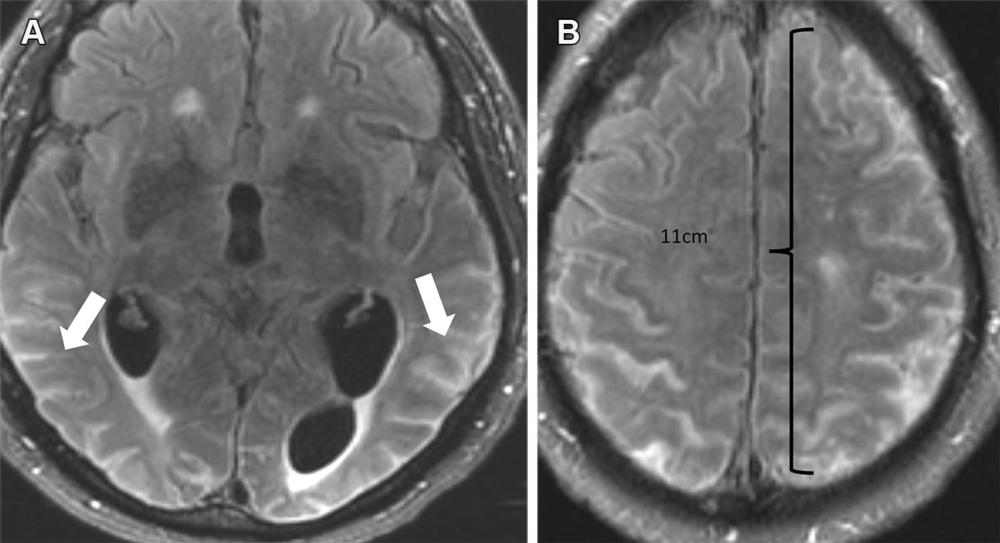
Figure 10. Severe ARIA-E (effusion) in a 76-yearold man with worsening headaches receiving aducanumab therapy for AD. Axial brain MR images from December 2021 (3 weeks after full dose) show multifocal exudates along the sulci with FLAIR hyperintensity (arrows in A), measuring more than 10 cm (severe) with subtle leptomeningeal enhancement (B). Treatment was suspended, and complete resolution of effusion was noted after cessation of therapy.
High-res (TIF) version
(Right-click and Save As)
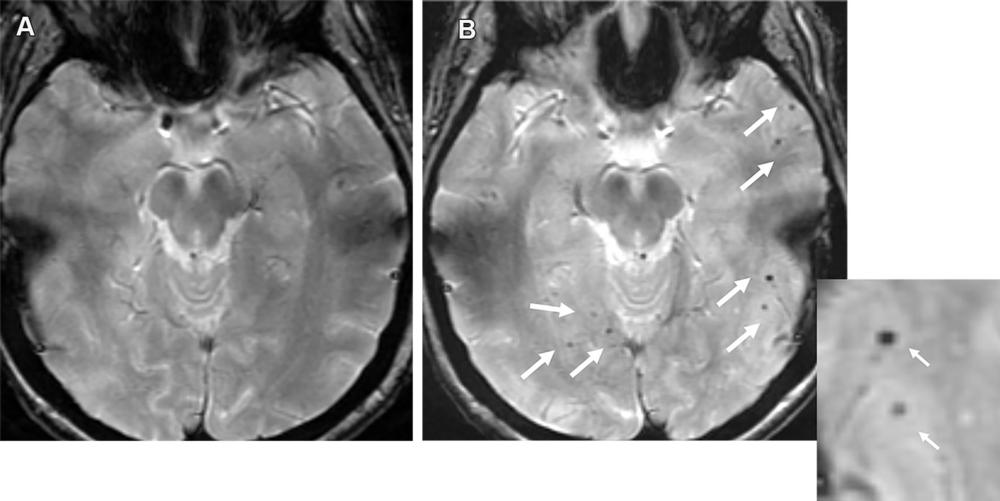
Figure 11. Moderate ARIA-H (microhemorrhage) in a 70-year-old man with no clinical symptoms receiving aducanumab therapy. Baseline axial GRE MR image (A) was unremarkable, with the development of seven new microhemorrhages (arrows in B) depicted on the follow-up image (B) and magnified inset image obtained 7 weeks after the target dose. Therapy was suspended for few weeks and was resumed following documentation of stable findings at follow-up MRI. It is important to maintain consistency in the sequence type (T2*-weighted GRE) and scanner type (all examinations performed with same strengths) as technical factors can result in miscounting of the number of microhemorrhages.
High-res (TIF) version
(Right-click and Save As)
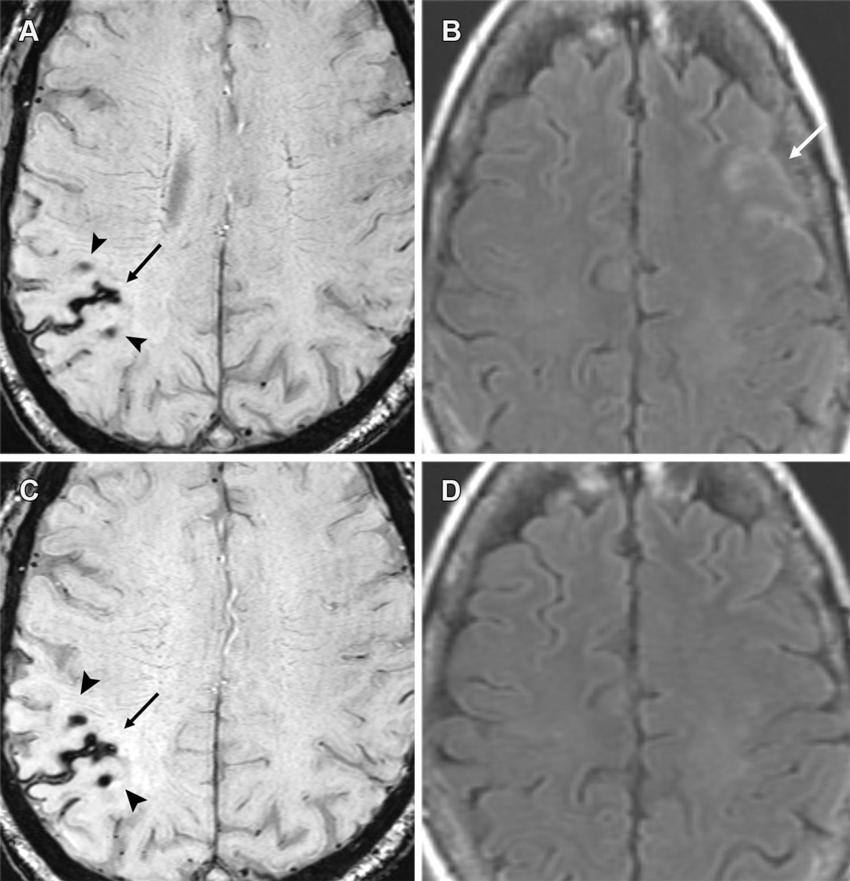
Figure 12. Moderate ARIA-E (edema) and ARIA-H (microhemorrhages, superficial siderosis) in a 60-year-old woman with headaches receiving aducanumab therapy. (A, B) Baseline MRI was unremarkable, with sequential MRI performed at 4 and 8 weeks after full dose. Axial T2*-weighted GRE (A) and FLAIR (B) MR images from the 4th-week examination show a new area of superficial siderosis (arrow in A), two microhemorrhages (arrowheads in A) in the right parietal convexity, and a subtle area of effusion (arrow in B) along the left frontal sulci. Therapy was suspended given the moderate radiographic findings and mild clinical symptoms. (C, D) Follow-up axial MR images at 8 weeks show stable hemorrhagic changes (arrow and arrowheads in C) on the T2*-weighted GRE image (C) with complete resolution of effusion on the FLAIR image (D). Superficial siderosis is the least common manifestation of ARIA and can be symptomatic, frequently requiring temporary or complete cessation of therapy.
High-res (TIF) version
(Right-click and Save As)
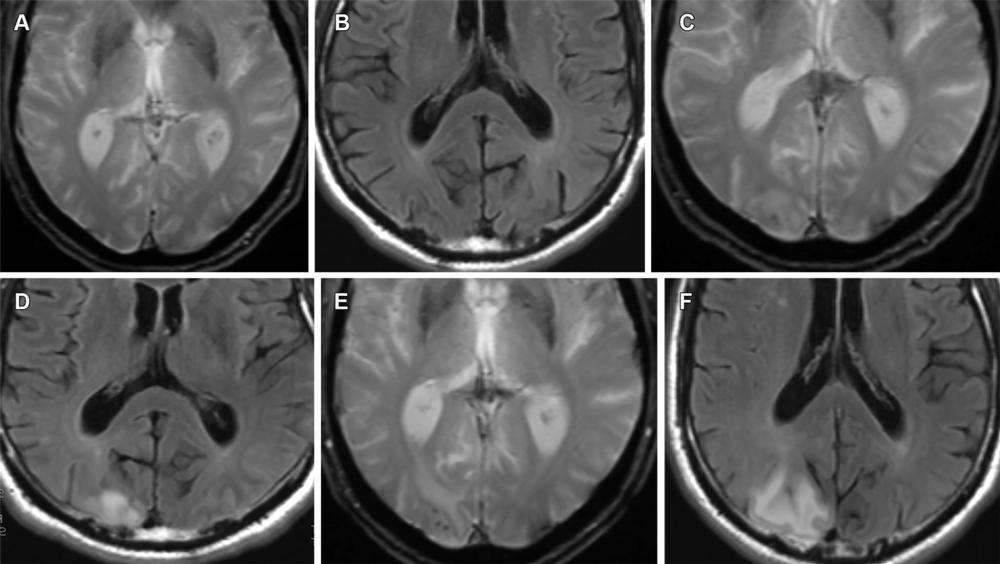
Figure 13. Mild ARIA-E (edema) and ARIA-H (microhemorrhage) in a 62-year-old woman with no clinical symptoms receiving aducanumab therapy. Sequential T2*-weighted GRE image and FLAIR MR images, respectively, are unremarkable at baseline (A, B), show solitary microhemorrhage and mild edema at 4 weeks (C, D), and show progression of edema and microhemorrhages after 8 weeks (E, F). Although the edema is usually reversible, the microhemorrhages persist, as is seen on the follow-up MR images in this case. Edema and microhemorrhages can frequently coexist (ARIA-E+H) and are graded separately, with the therapy decision based on the highest grade of severity.
High-res (TIF) version
(Right-click and Save As)
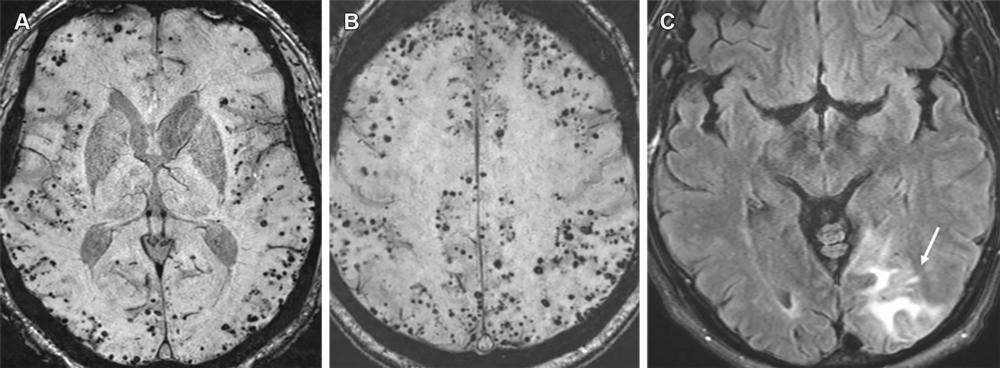
Figure 14. Advanced CAA with inflammatory changes (CAA-RI) in a 76-year-old man. (A, B) Axial susceptibility-weighted images show innumerable microhemorrhages in a peripheral lobar pattern. The patient subsequently presented to the emergency department with mental status changes, and MRI was performed. (C) Axial MR image shows cortical-subcortical edema (arrow) in the left occipital lobe consistent with acute inflammatory changes (CAA-RI). The imaging findings are indistinguishable from those of ARIA, and the differentiation is based primarily on clinical history. Moreover, patients with such a high number of microhemorrhages at pretreatment imaging are usually excluded from MAB clinical trials.
High-res (TIF) version
(Right-click and Save As)
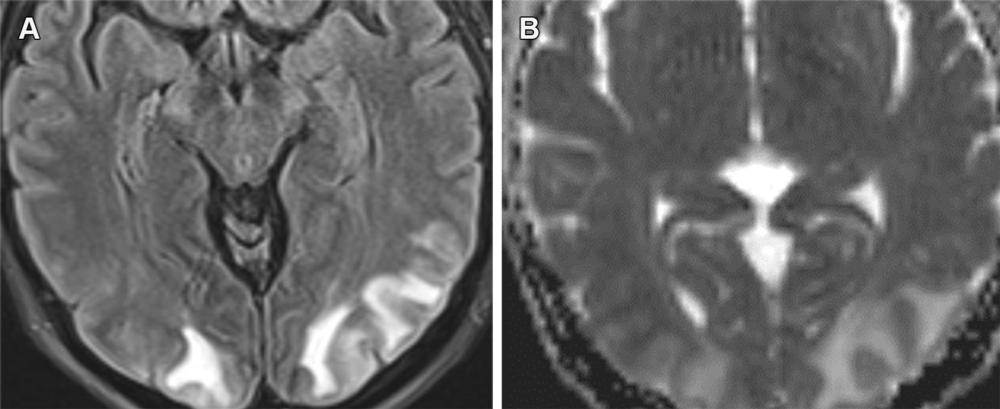
Figure 15. PRES secondary to hypertensive urgency with subcortical area of edema in the occipital lobes with FLAIR hyperintensity (A) and increased ADC values (B). ARIA-E (edema) resembles PRES, with both having a predilection for the occipital lobes with the possibility of petechial hemorrhages. However, these conditions are distinguishable based on the clinical history, with PRES usually having an acute clinical presentation.
High-res (TIF) version
(Right-click and Save As)
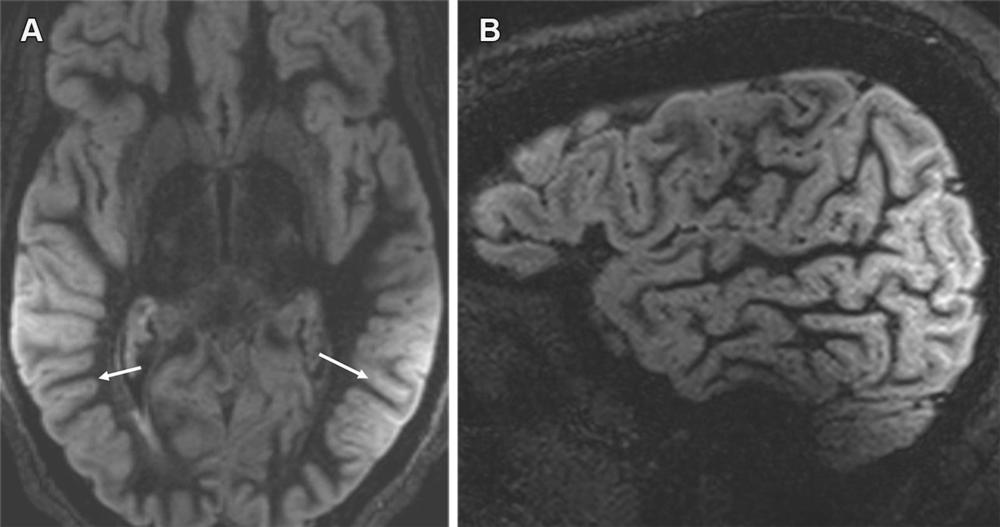
Figure 16. Shading artifact. Axial MR image (A) shows shading artifact with hyperintense signal within the sulci in the temporoparietal regions bilaterally (arrows in A) and loss of signal intensity in the frontal region on a sagittal direct inversion-recovery MR image (B), secondary to improper coil placement. Numerous technical factors can cause artifactual FLAIR sulcal hyperintensity, which can mimic ARIA-E (effusion). However, it can sometimes be corrected by fixing the underlying cause, such as by adjusting to the proper size and loading of the coil or shimming to reduce inhomogeneity of the magnetic field.
High-res (TIF) version
(Right-click and Save As)
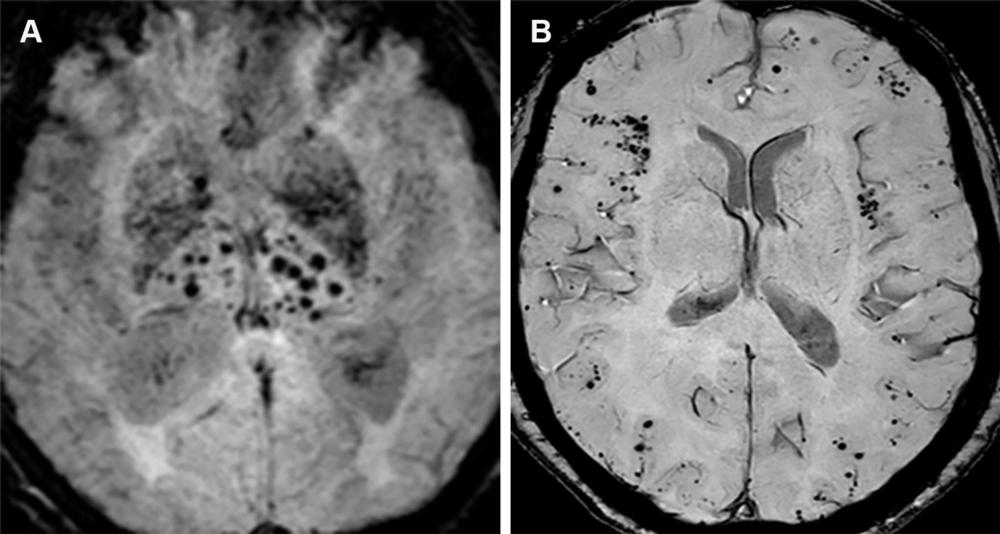
Figure 17. Hypertensive angiopathy and CAA are the two most common causes of cerebral microhemorrhages. Axial susceptibility-weighted image (A) shows a central pattern of microhemorrhages characteristic of hypertensive angiopathy, whereas on the axial susceptibility-weighted image (B), amyloid angiopathy is characterized by a peripheral/lobar pattern.
High-res (TIF) version
(Right-click and Save As)