AI Uses Lung CT Data to Predict Mortality Risk
Released: July 25, 2023
At A Glance
- AI can automatically derive body composition measurements from low-dose lung CT to help predict risk of death from lung cancer, cardiovascular disease and other causes.
- Abnormal body composition, such as obesity and loss of muscle mass, is linked with chronic health conditions like metabolic disorders.
- Measurements associated with fat found within a muscle were particularly strong predictors of mortality.
- RSNA Media Relations
1-630-590-7762
media@rsna.org - Linda Brooks
1-630-590-7738
lbrooks@rsna.org - Imani Harris
1-630-481-1009
iharris@rsna.org
OAK BROOK, Ill. — Artificial intelligence (AI) can use data from low-dose CT scans of the lungs to improve risk prediction for death from lung cancer, cardiovascular disease and other causes, according to a study published in Radiology, a journal of the Radiological Society of North America (RSNA).
The U.S Preventive Services Task Force recommends annual lung screening with low-dose CT (LDCT) of the chest for individuals ages 50 to 80 years with a high risk of lung cancer, such as longtime smokers. Along with images of the lungs, the scans also provide information about other structures in the chest.
"When we're looking at the CT images, the primary focus is on identifying nodules suspicious for lung cancer, but there is much more anatomical information coded in the space, including information on body composition," said study lead author Kaiwen Xu, a Ph.D. candidate in the Department of Computer Science at Vanderbilt University in Nashville, Tenn.

Xu and colleagues previously developed, tested and publicly released an AI algorithm that automatically derives body composition measurements from lung screening LDCT. Body composition is a measure of the percentage of fat, muscle and bone in the body. Abnormal body composition, such as obesity and loss of muscle mass, is linked with chronic health conditions like metabolic disorders. Studies have also shown that body composition is useful in risk stratification and prognosis for cardiovascular disease and chronic obstructive pulmonary disease. In lung cancer therapy, body composition has been shown to affect survival and quality of life.
For the new study, the researcher assessed the added value of the AI-derived body composition measurements. They used the CT scans of more than 20,000 individuals drawn from the National Lung Screening Trial.
Results showed that including these measurements improved risk prediction for death from lung cancer, cardiovascular disease and all-cause mortality.
"Automatic AI body composition potentially extends the value of lung screening with low-dose CT beyond the early detection of lung cancer," Xu said. "It can help us identify high-risk individuals for interventions like physical conditioning or lifestyle modifications, even at a very early stage before the onset of disease."
Measurements associated with fat found within a muscle were particularly strong predictors of mortality—a finding consistent with existing research. Infiltration of skeletal muscle with fat, a condition known as myosteatosis, is now thought to be more predictive for health outcomes than reduced muscle bulk.
The body composition measurements from lung screening LDCT are an example of opportunistic screening when imaging for one purpose provides information about other conditions. The practice is thought to have great potential for routine clinical use.
"The images in a CT ordered for quite a different purpose—in our case, early detection of lung cancer—contain much more information," Xu said. "In the space of the chest CT used for lung cancer screening, you can also check other information like body composition or coronary artery calcification that is directly associated with cardiovascular disease risk."
The study looked at individuals at a baseline screening only. For future research, the researchers want to perform a study longitudinally; that is, follow the individuals over time to see how changes in the body composition relate to health outcomes.
"AI Body Composition in Lung Cancer Screening: Added Value Beyond Lung Cancer Detection." Collaborating with Kaiwen Xu were Mirza S. Khan, M.D., M.S., Thomas Z. Li, B.S., Riqiang Gao, Ph.D., James G. Terry, M.S., Yuankai Huo, Ph.D., Thomas A. Lasko, M.D., Ph.D., John Jeffrey Carr, M.D., M.Sc., Fabien Maldonado, M.D., M.Sc., Bennett A. Landman, Ph.D., and Kim L. Sandler, M.D.
In 2023, Radiology is celebrating its 100th anniversary with 12 centennial issues, highlighting Radiology's legacy of publishing exceptional and practical science to improve patient care.
Radiology is edited by Linda Moy, M.D., New York University, New York, N.Y., and owned and published by the Radiological Society of North America, Inc. (https://pubs.rsna.org/journal/radiology)
RSNA is an association of radiologists, radiation oncologists, medical physicists and related scientists promoting excellence in patient care and health care delivery through education, research and technologic innovation. The Society is based in Oak Brook, Illinois. (RSNA.org)
For patient-friendly information on CT and lung cancer screening, visit RadiologyInfo.org.
Images (JPG, TIF):
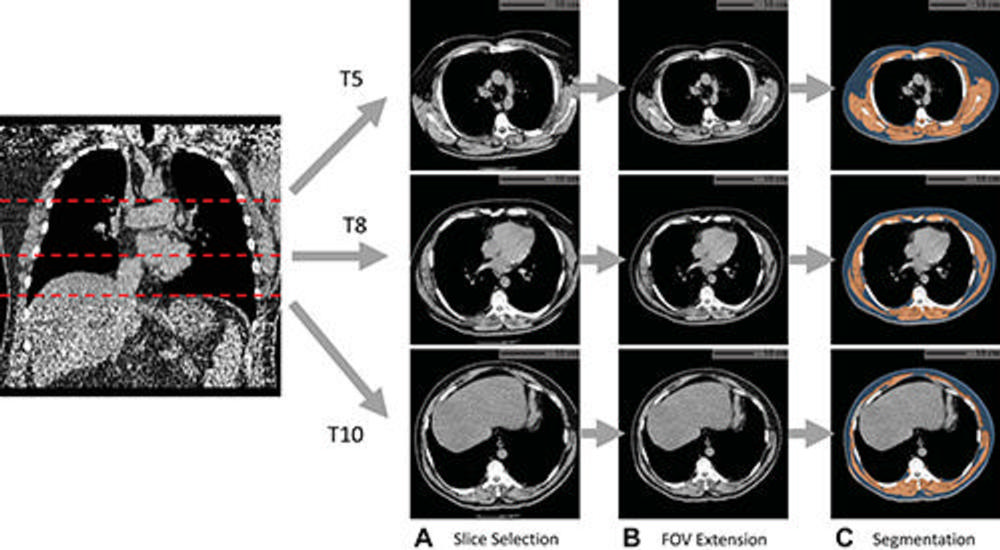
Figure 1. Example of fully automated body composition assessment in the lung cancer screening noncontrast low-dose chest CT scan in a 57-year-old male participant. (A) CT axial plane levels corresponding to the fifth (T5), eighth (T8), and 10th (T10) vertebral bodies were predicted. Corresponding axial CT sections were selected for body composition assessment. (B) The field of view (FOV) of each CT section with body section truncation was extended with missing body section imputation. (C) Areas of subcutaneous adipose tissue (SAT) (blue) and skeletal muscle (SM) (orange) were segmented on the field-of-view extended sections. Body composition measurements include SM index (166.2, normal group), SM attenuation (17.5 HU, lower group), SM SD (41.0 HU, normal group), SAT index (189.7, higher group), SAT attenuation (−88.4 HU, normal group), and SAT SD (28.0 HU, higher group). Indexes were calculated as summed area (in square centimeters) across three levels divided by participant height squared (in square meters).
High-res (TIF) version
(Right-click and Save As)
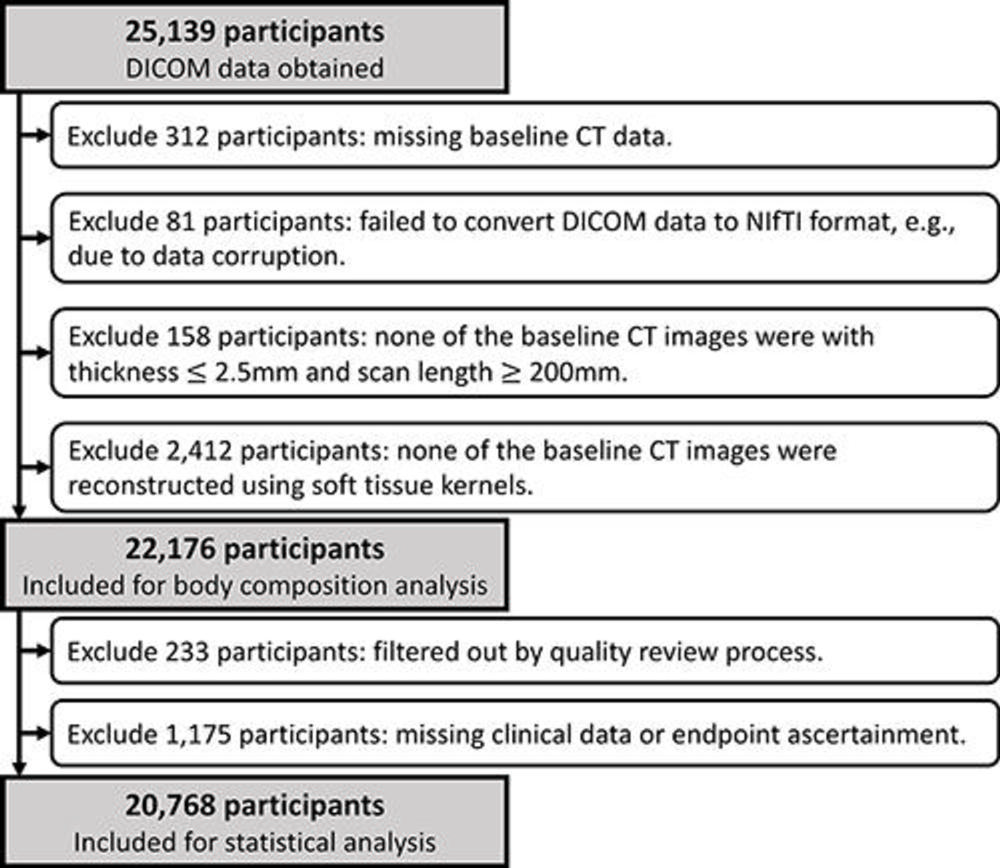
Figure 2. Cohort selection flowchart. A total of 2,963 participants were excluded from body composition analysis due to missing baseline CT data (n = 312), image data corruption (n = 81), images failing the section thickness or scan length requirement (n = 158), or images failing the requirement for soft-tissue reconstruction kernels (n = 2412). Then, 1,408 participants were excluded due to images failing the quality review process (n = 233) or to missing clinical data or end point ascertainment (n = 1175). DICOM = Digital Imaging and Communications in Medicine, NIfTI = Neuroimaging Informatics Technology Initiative.
High-res (TIF) version
(Right-click and Save As)
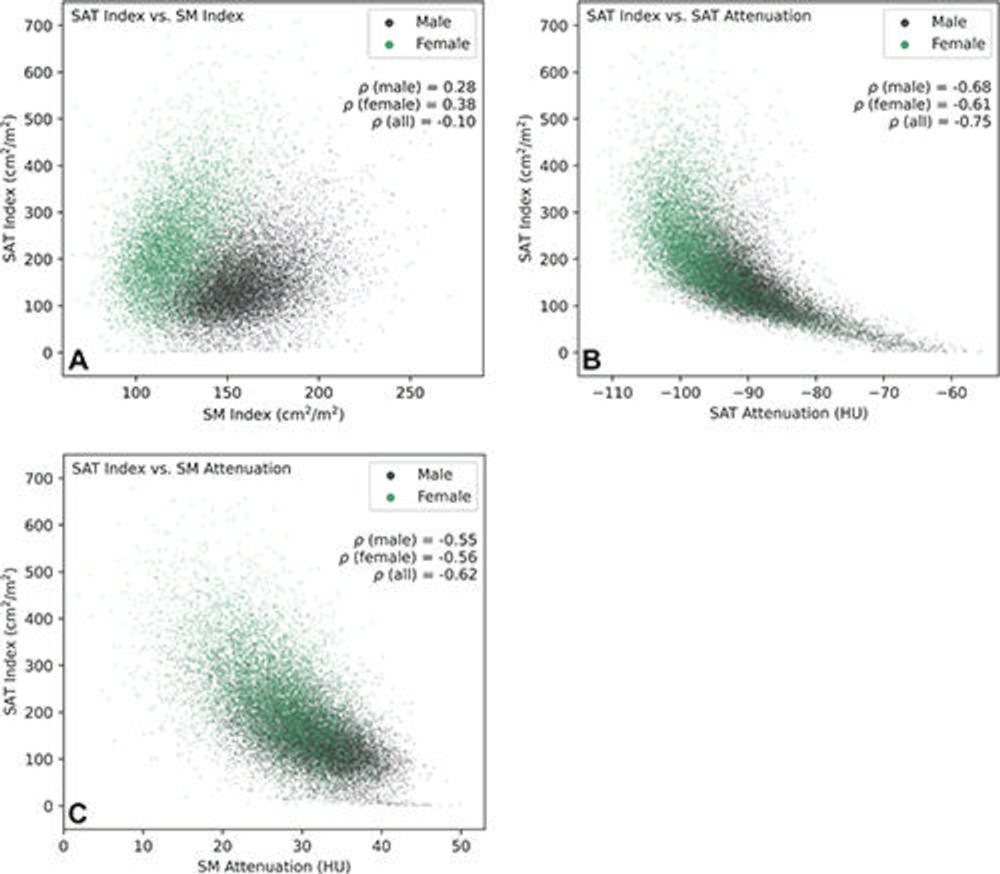
Figure 3. Pairwise associations of subcutaneous adipose tissue (SAT) index with SAT attenuation, skeletal muscle (SM) index, and SM attenuation of participants included in statistical analysis (20,768 participants: 12,317 male and 8,451 female). (A) Scatterplot shows the association between SAT index and SM index. Analysis indicated weak positive correlations between SAT index and SM index in male and female participants and a very weak negative correlation when combined. Separation in the joint distributions of male and female participants was observed, with male participants showing a higher SM index and a lower SAT index, while female participants showed a lower SM index and a higher SAT index. (B) Scatterplot shows the association between SAT index and SAT attenuation. Strong negative correlations were observed between SAT index and SAT attenuation in male, female, and all participants. Nonlinear correlation patterns can be observed in the joint distributions approximated by the scatterplot. (C) Scatterplot shows the association between SAT index and SM attenuation. Analysis indicated moderate negative correlations between SAT index and SM attenuation in male and female participants and a strong negative correlation when combined.
High-res (TIF) version
(Right-click and Save As)
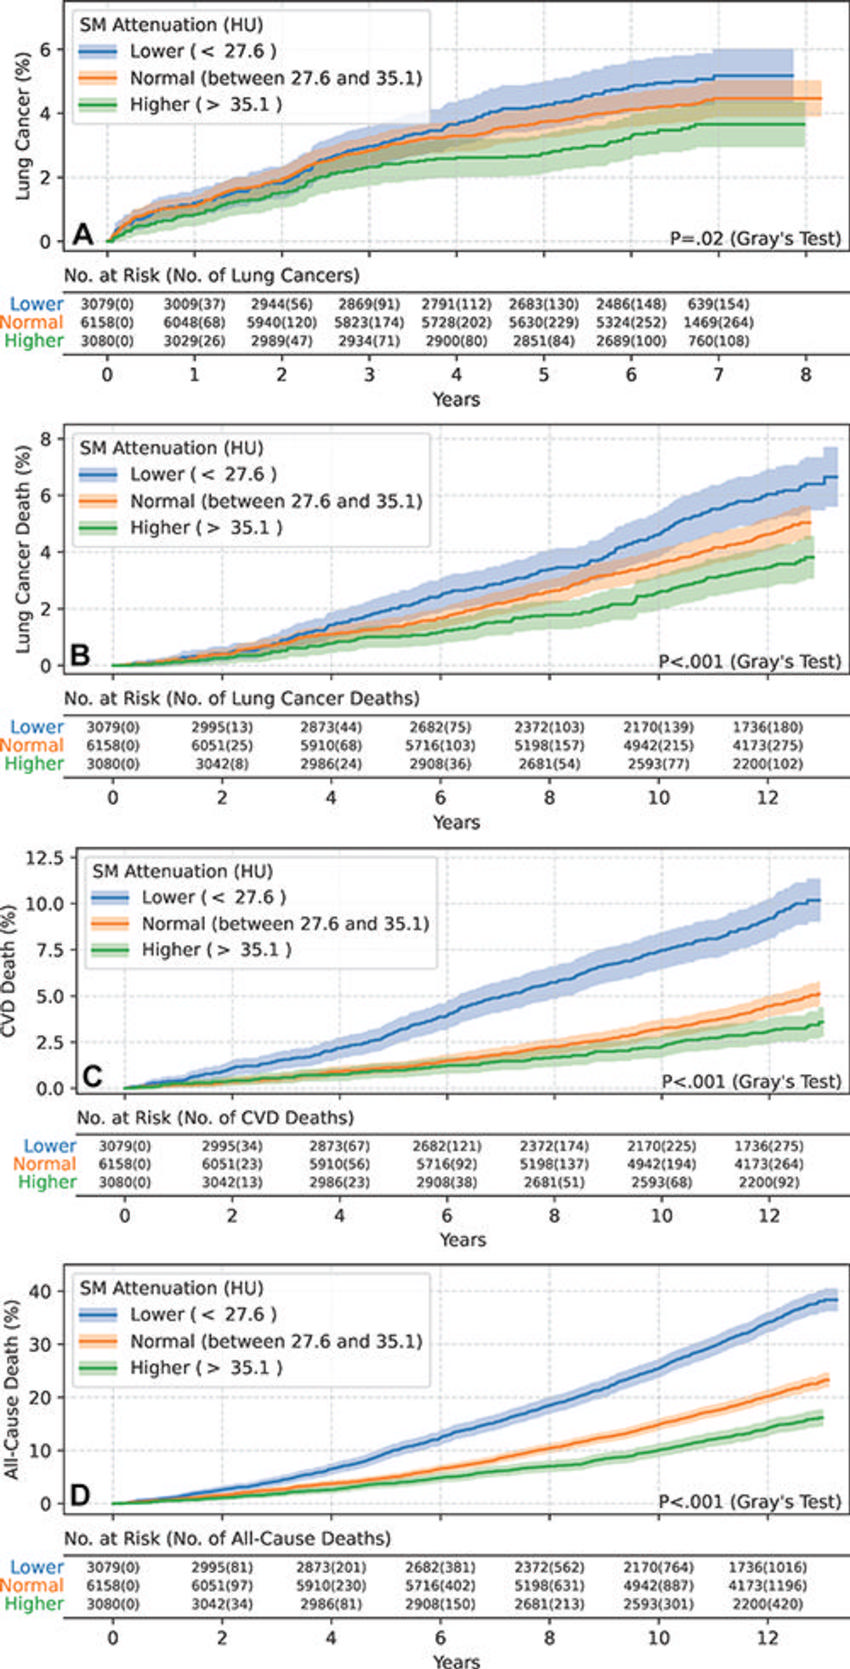
Figure 4. Estimated cumulative incidence functions of each end point in male participants (n = 12,317) stratified by skeletal muscle (SM) attenuation values of 27.6 HU (25th percentile) and 35.1 HU (75th percentile) as lower (<27.6 HU), normal (between 27.6 HU and 35.1 HU), and higher (>35.1 HU) groups. Solid step lines represent estimated cumulative incidence functions, while semitransparent bands represent 95% CIs. P values were derived with use of the Gray test for separation between cumulative incidence functions. (A) Plot displays the estimated cumulative incidence of lung cancer for each group. Compared with the normal group, the lower group exhibited a higher incidence of lung cancer, while the higher group exhibited a lower incidence of lung cancer. (B) Plot displays the estimated cumulative incidence of lung cancer death for each group. Compared with the normal group, the lower group exhibited a higher incidence of lung cancer death, while the higher group exhibited a lower incidence of lung cancer death. (C) Plot displays the estimated cumulative incidence of cardiovascular disease (CVD) death for each group. Compared with the normal group, the lower group exhibited a higher incidence of CVD death, while the higher group exhibited a lower incidence of CVD death. (D) Plot displays the estimated cumulative incidence of all-cause death for each group. Compared with the normal group, the lower group exhibited a higher incidence of all-cause death, while the higher group exhibited a lower incidence of all-cause death.
High-res (TIF) version
(Right-click and Save As)
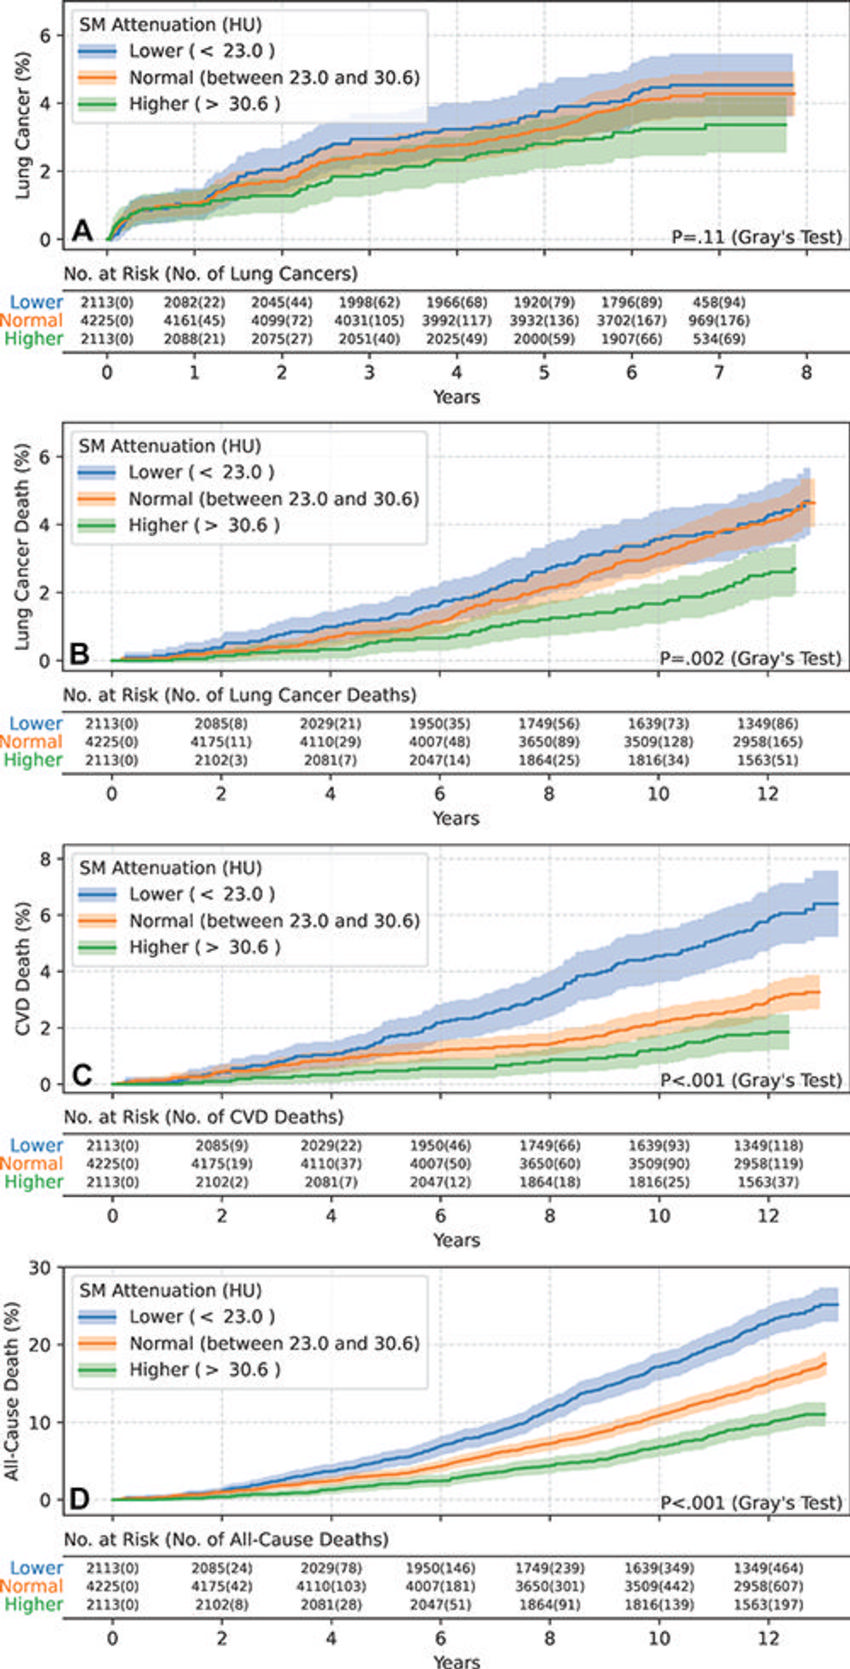
Figure 5. Estimated cumulative incidence functions of each end point in female participants (n = 8451) stratified by skeletal muscle (SM attenuation) values of 23.0 HU (25th percentile) and 30.6 HU (75th percentile) as lower (<23.0 HU), normal (between 23.0 HU and 30.6 HU), and higher (>30.6 HU) groups. Solid step lines represent estimated cumulative incidence functions, while semitransparent bands represent 95% CIs. P values were derived with use of the Gray test for separation between cumulative incidence functions. (A) Plot displays the estimated cumulative incidence of lung cancer for each group. Separation of cumulative incidence functions was not observed (P = .11). (B) Plot displays the estimated cumulative incidence of lung cancer death for each group. Compared with the lower and normal groups, the higher group exhibited a lower incidence of lung cancer death. (C) Plot displays the estimated cumulative incidence of cardiovascular disease (CVD) death for each group. Compared with the normal group, the lower group exhibited a higher incidence of CVD death, while the higher group exhibited a lower incidence of CVD death. (D) Plot displays the estimated cumulative incidence of all-cause death for each group. Compared with the normal group, the lower group exhibited a higher incidence of all-cause death, while the higher group exhibited a lower incidence of all-cause death.
High-res (TIF) version
(Right-click and Save As)
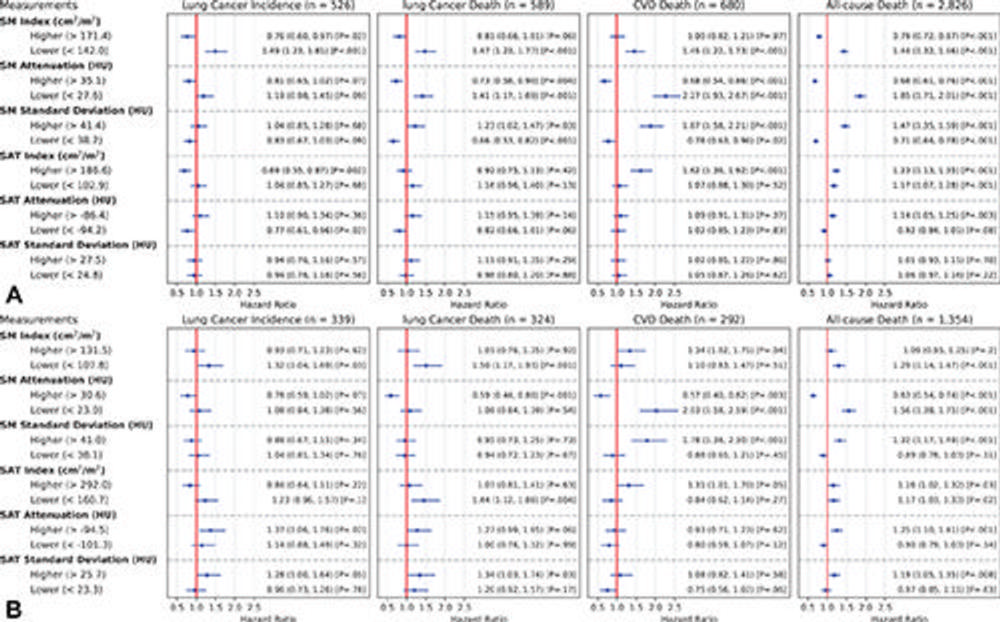
Figure 6. Estimated unadjusted hazard ratios (HRs) of the lower and higher groups, with the normal group as reference for each body composition measurement (rows) and each end point event (columns) in male and female participants. The groups were obtained by the stratification based on the sex-specific 25th and 75th percentiles for each measurement. (A) Plot displays the estimated unadjusted HRs in male participants (n = 12,317). (B) Plot displays the estimated unadjusted HRs in female participants (n = 8,451). The dots represent the estimated HRs. The segments represent the 95% CIs of the estimated HRs. The HR of 1 (no difference in hazard) is displayed as a red line in each plot for reference. The numbers following each dot-segment combination show the numerical value of the HR, with the 95% CI in parentheses and the associated P value in square brackets. For instance, as indicated by the fourth row in the column “CVD Death (n = 680)” in A, the lower skeletal muscle (SM) attenuation group in male participants (<27.6 HU) was associated with higher risk for cardiovascular disease (CVD) death (HR, 2.27 [95% CI: 1.93, 2.67]; P < .001) when compared with the normal group, which is consistent with observations in Figure 4C based on cumulative incidence functions. SAT = subcutaneous adipose tissue.
High-res (TIF) version
(Right-click and Save As)