Photon-counting CT Can Evaluate Lung Function
Released: July 11, 2023
At A Glance
- Researchers developed a chest imaging protocol that simultaneously yields information on structure and function of the lungs.
- Photon-counting CT enables high image quality at a radiation dose below that of a standard chest CT.
- The new protocol requires advanced software but no additional hardware.
- RSNA Media Relations
1-630-590-7762
media@rsna.org - Linda Brooks
1-630-590-7738
lbrooks@rsna.org - Imani Harris
1-630-481-1009
iharris@rsna.org
OAK BROOK, Ill. — New CT technology allows for a comprehensive, simultaneous evaluation of lung structure and function, something not possible with standard CT, according to a study published in Radiology, a journal of the Radiological Society of North America (RSNA).
Chest CT is the imaging method of choice for analyzing lung disease and tracking changes over time. However, CT studies of lung function and perfusion, or blood flow, require dedicated protocols that cannot be combined.
Researchers in Germany and the Netherlands developed a chest imaging protocol that yields information on structure and function of the lungs as a one-stop-shop procedure. The protocol uses recently introduced photon-counting CT technology. Photon-counting CT enables high image quality at a radiation dose below that of a standard chest CT. In addition, it provides better spatial resolution and options for spectral imaging, which uses energy information from the X-rays to characterize tissue composition. The new protocol requires advanced software but no additional hardware.
The researchers studied the protocol in 197 patients with clinically indicated CT for various known and unknown lung function impairment. After administration of an intravenous contrast agent, the photon-counting CT scan was taken when the patients inhaled. This was followed by a scan when the patients exhaled.
In 166 patients, the researchers were able to acquire all CT-derived parameters, for a success rate of 85%.

The protocol allowed for simultaneous evaluation of lung structure, ventilation, vasculature and perfusion of the parenchyma, the region of the lungs that contain the gas-exchanging alveoli. The alveoli are tiny air sacs where the lungs and the blood exchange oxygen and carbon dioxide during the process of breathing in and out. The protocol showed advantages over standard CT.
"The improvement in the contrast-to-noise ratio and spatial resolution of the pulmonary blood volume images was substantial," said study senior author Hoen-oh Shin, M.D., professor of radiology at the Institute of Diagnostic and Interventional Radiology at Hannover Medical School in Hannover, Germany. "In my opinion, the most important advantage is the significantly improved spectral resolution, which enables new applications such as functional imaging of the lungs with CT."
The photon-counting CT protocol has other promising applications in lung imaging. It can provide important preoperative identification of areas of emphysema and perfusion defects in patients with chronic thromboembolic pulmonary hypertension, a progressive disease caused by blood clots that do not clear from the lungs.
Postoperatively, the protocol allowed evaluation of surgical success and was helpful in assessing the lungs after lung or stem cell transplant procedures. It may also be useful in follow-up of chronic obstructive pulmonary disease and looking at pathological findings in the lung tissue.
"We believe that the proposed protocol is generally valuable for diseases with known or unknown lung function impairment," Dr. Shin said.
Dr. Shin and colleagues first applied the protocol to patients with interstitial lung disease, a group of diseases that cause progressive scarring of the lung tissue. They then expanded the applications to include post-COVID-19 condition where interstitial lung disease sometimes develops.
"With the proposed protocol, we have also been able to answer many other questions related to post-COVID-19 condition, such as the detection of acute and chronic pulmonary emboli on CT angiography, and we are currently investigating whether perfusion changes can be quantified in microvascular damage or inflammatory areas," Dr. Shin said.
The researchers are working to improve processing time and increase the robustness of the technique.
"Regional ventilation and perfusion depend on patient position and gravity, among other factors," Dr. Shin said. "Further studies are needed to assess the dependence on position and depth of breathing, as well as the reproducibility of the measurements."
"Regional Pulmonary Morphology and Function: Photon-counting CT Assessment." Collaborating with Dr. Shin were Sarah C. Scharm, M.D., Cornelia Schaefer-Prokop, M.D., Hinrich B. Winther, M.D., Carolin Huisinga, M.D., Thomas Werncke, M.D., Jens Vogel-Claussen, M.D., and Frank K. Wacker, M.D.
In 2023, Radiology is celebrating its 100th anniversary with 12 centennial issues, highlighting Radiology's legacy of publishing exceptional and practical science to improve patient care.
Radiology is edited by Linda Moy, M.D., New York University, New York, N.Y., and owned and published by the Radiological Society of North America, Inc. (https://pubs.rsna.org/journal/radiology)
RSNA is an association of radiologists, radiation oncologists, medical physicists and related scientists promoting excellence in patient care and health care delivery through education, research and technologic innovation. The Society is based in Oak Brook, Illinois. (RSNA.org)
For patient-friendly information on chest CT, visit RadiologyInfo.org.
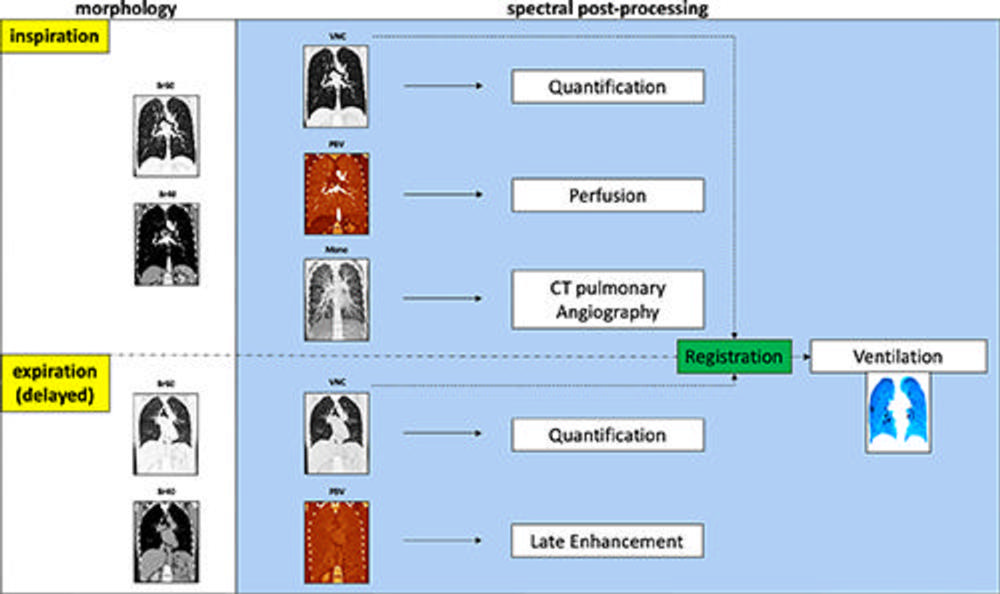
Figure 1. Schematic shows the advanced postprocessing used to generate images from acquired inspiration and expiration data. For morphologic assessment, reconstruction with soft tissue and lung kernel was performed (Br40 and Br60). In addition, virtual noncontrast-enhanced (VNC) images, pulmonary blood volume (PBV) images, and monoenergetic (Mono) images were reconstructed. The virtual noncontrast-enhanced images can be used for visual morphologic analysis and quantification of attenuation values in the lung parenchyma (eg, emphysema and/or air trapping). Inspiration pulmonary blood volume was a surrogate for lung perfusion and pulmonary blood volume in expiration (obtained with a 5-minute delay) was used to show late enhancement. The monoenergetic image at inspiration served as CT angiography. With the exception of the ventilation images, all spectral images were reconstructed using the photon-counting CT scanner and sent to the picture archiving and communication system. Regional ventilation was calculated by registering inspiration virtual noncontrast-enhanced images to expiration images using in-house software with a dedicated workstation. CT-derived parameters for perfusion and ventilation are shown in a color-coded format (shades of blue, ventilation; shades of red, perfusion).
High-res (TIF) version
(Right-click and Save As)
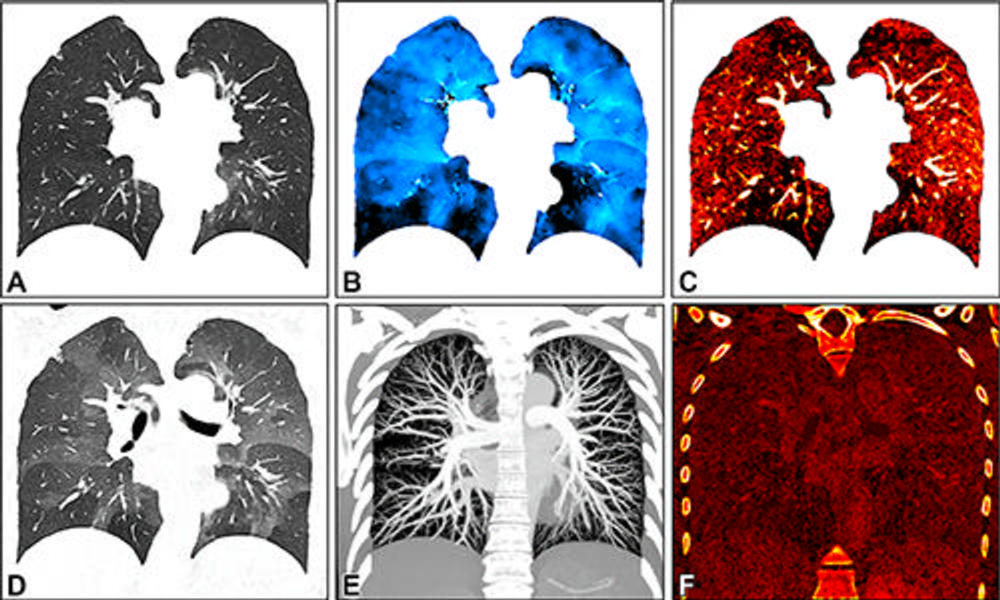
Figure 2. Images in a 34-year-old female patient show severe smoking-associated small airway disease with patchy ground-glass opacities and mosaic pattern. The images were generated with spectral postprocessing on a coronal plane at (A) inspiration (warped for voxelwise matching with expiration), (B) ventilation, (C) perfusion, (D) expiration, (E) CT angiography, and (F) late contrast enhancement. Quantitative parameters include whole lung or lobar volume, and inspiratory (A) and expiratory (D) attenuation and functional parameters such as ventilation (B) , perfusion (C) , and late contrast enhancement (F) . They are described using descriptive statistics or histogram analysis. Corresponding functional maps show inhomogeneous ventilation with lobular air-trapping in the lower lobes and matched perfusion inhomogeneities. CT angiography (E) and late contrast enhancement (F) images show no abnormal findings.
High-res (TIF) version
(Right-click and Save As)
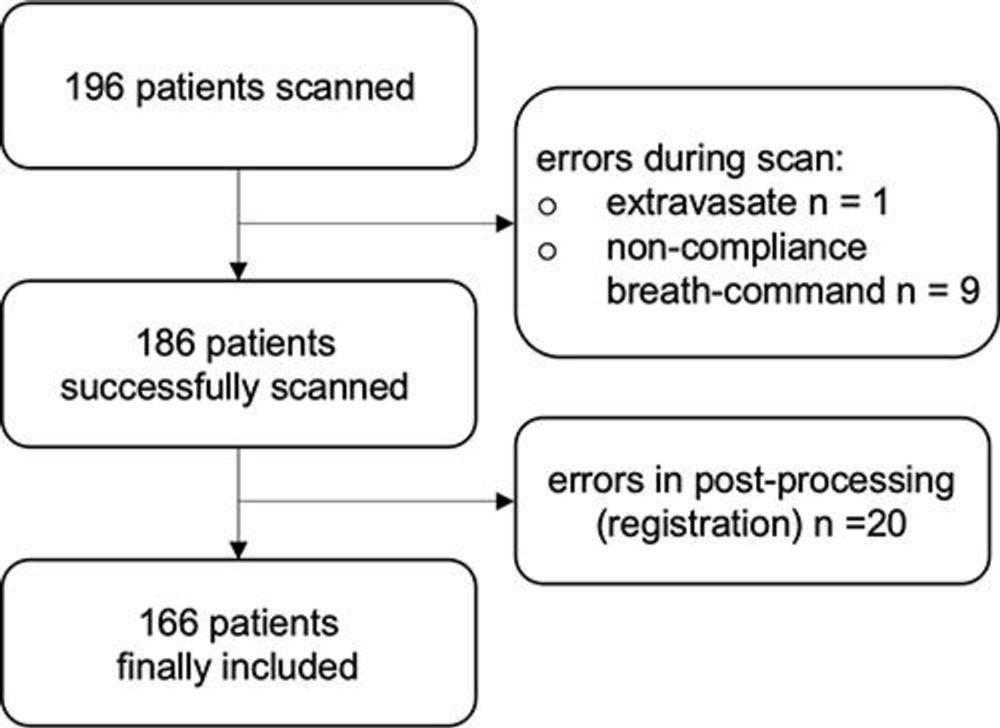
Figure 3. Inclusion flowchart shows potential causes for errors.
High-res (TIF) version
(Right-click and Save As)
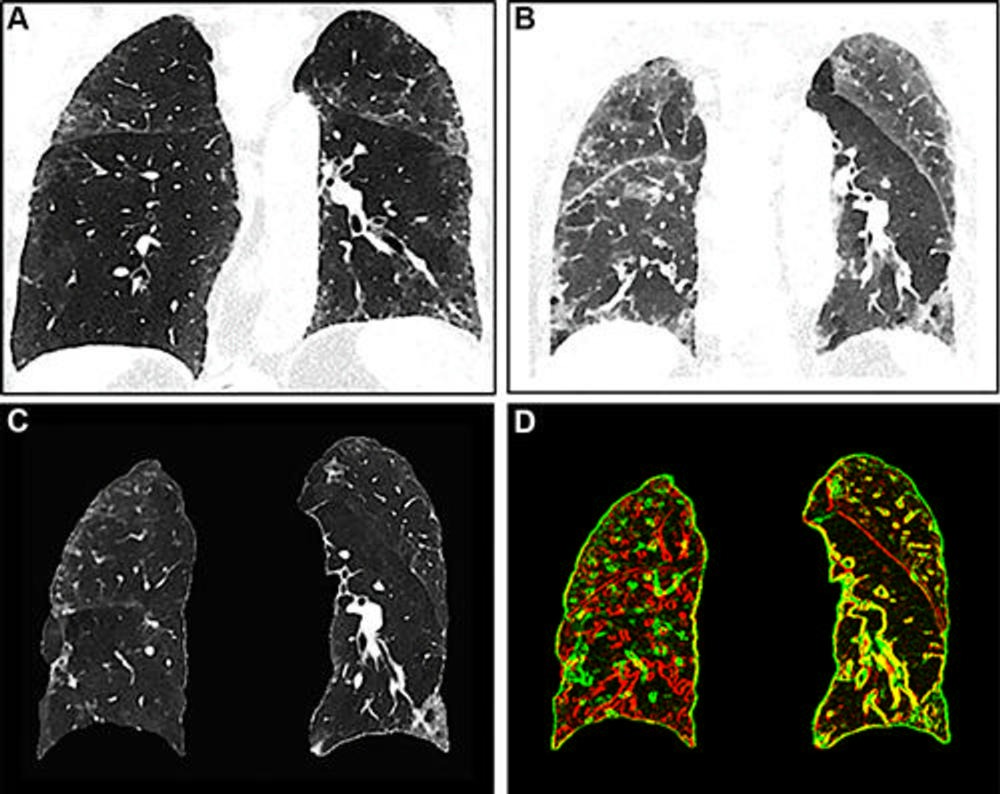
Figure 4. Images show registration error in the right lung. (A) Inspiration image, (B) expiration image, and (C) warped inspiration image. (D) A composite edge image of the expiration (red) and the warped inspiration (green) shows corresponding and well-aligned areas in yellow. The right lung shows mainly red and green edges of vessels and bronchi with poor registration, whereas the left lung shows a better match.
High-res (TIF) version
(Right-click and Save As)
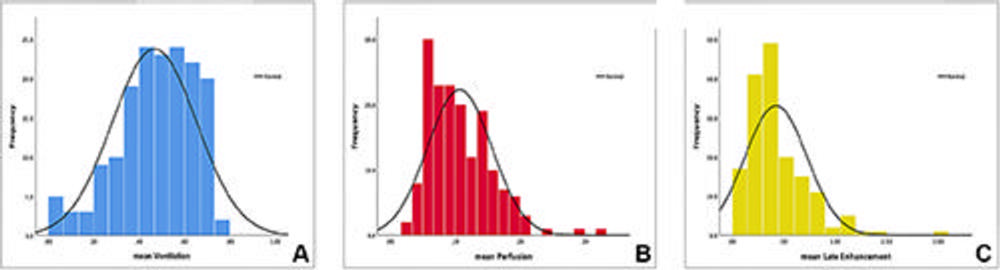
Figure 5. Histograms show the frequency distributions of the mean values of the (A) ventilation, (B) perfusion, and (C) late contrast enhancement parameters (normalized, relative, ranging from 0 to 1) in the entire patient sample, demonstrating the capacity of this protocol to acquire quantified data. The highest variability was seen in (A) ventilation, referring to the fact that the majority of study patients had various types of interstitial lung diseases. More research is needed to define normal reference values and correlate devi/ations of functional values to underlying pathology.
High-res (TIF) version
(Right-click and Save As)
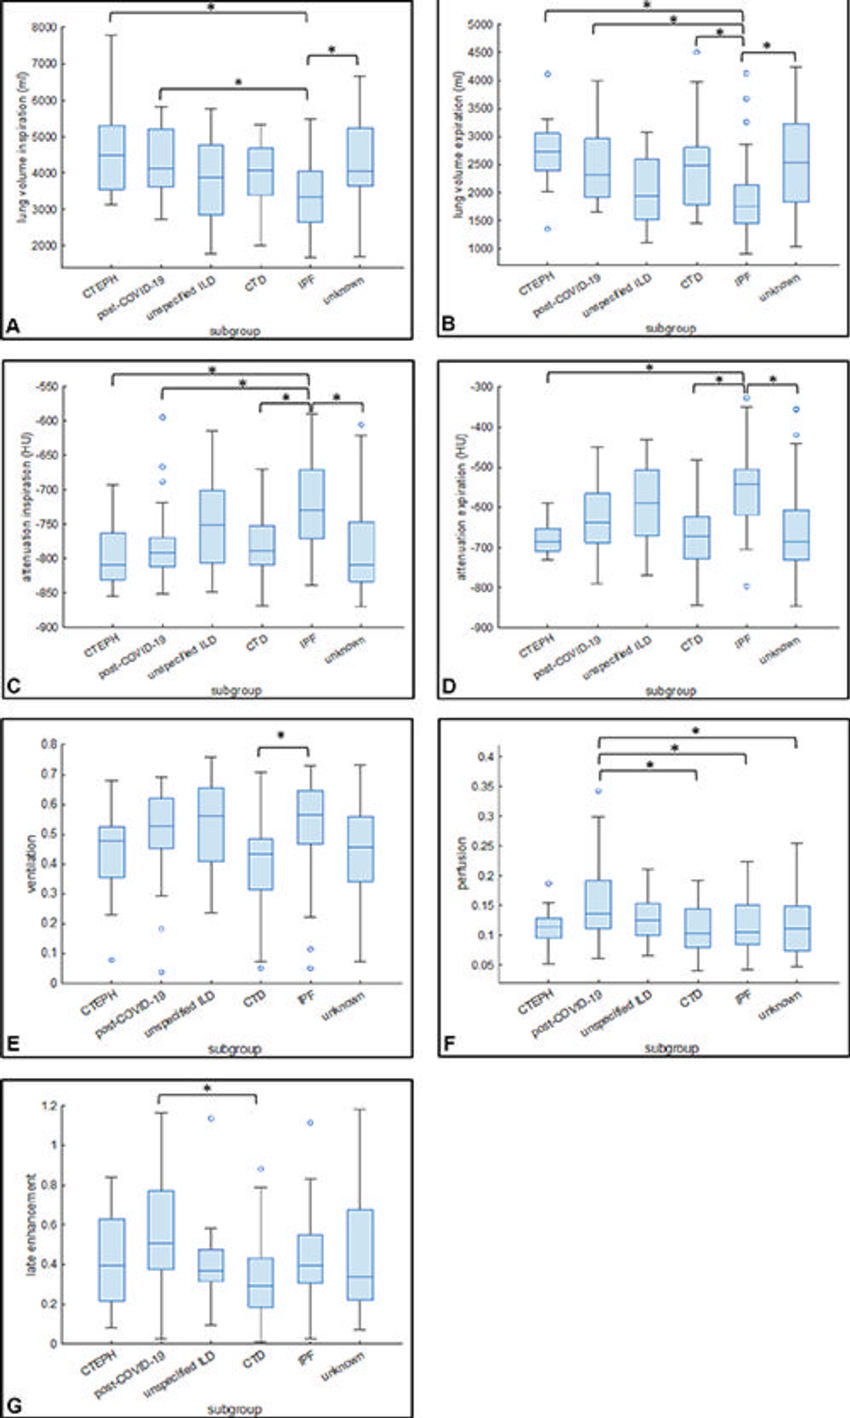
Figure 6. Box and whisker plots show the mean values of (A) lung volume at inspiration, (B) lung volume at expiration, (C) attenuation at inspiration, and (D) attenuation at expiration in the subgroups. Mean values of (E) ventilation, (F) perfusion, and (G) late contrast enhancement in the subgroups. Ο = Outliers. * = Statistically significant differences. Post–COVID-19 refers to the condition experienced by the patient after having a COVID-19 infection. CTD = connective tissue disease, CTEPH = chronic thromboembolic pulmonary hypertension, ILD = interstitial lung disease, IPF = idiopathic pulmonary fibrosis.
High-res (TIF) version
(Right-click and Save As)
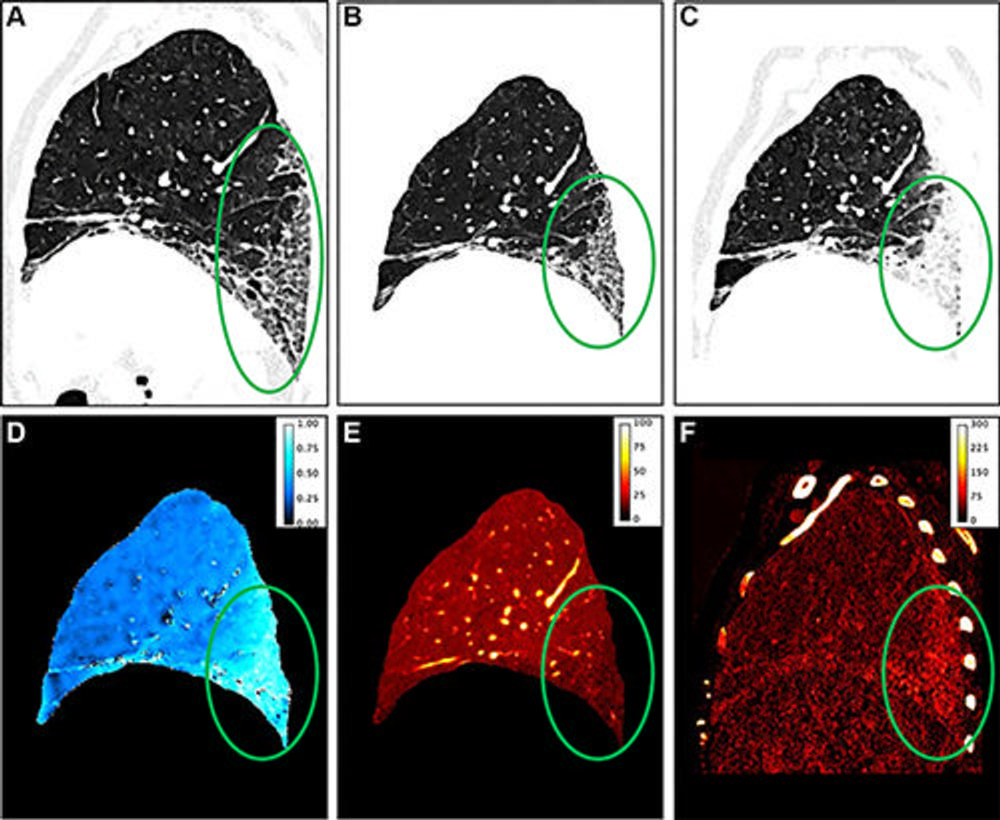
Figure 7. Representative sagittal images show pulmonary fibrosis induced by talcosis in a 71-year-old female patient. Circles show pathology. (A) Virtual noncontrast image at inspiration shows a usual interstitial pneumonia pattern. (B) Image shows the warped inspiration for better comparison. (C) Virtual noncontrast expiration image with extreme density increase in the fibrotic region and (D) a corresponding high ventilation indicating parenchymal collapse. Advanced fibrosis shows a decreased early perfusion (E) but a strong late contrast enhancement (F) . (Exemplary measurements with region of interest in the fibrotic area: ventilation, 0.84; perfusion, 5% of vessel contrast; late enhancement, 124% of vessel contrast.) Increased ventilation and late enhancement are considered precursors of fibrosis (5,20).
High-res (TIF) version
(Right-click and Save As)
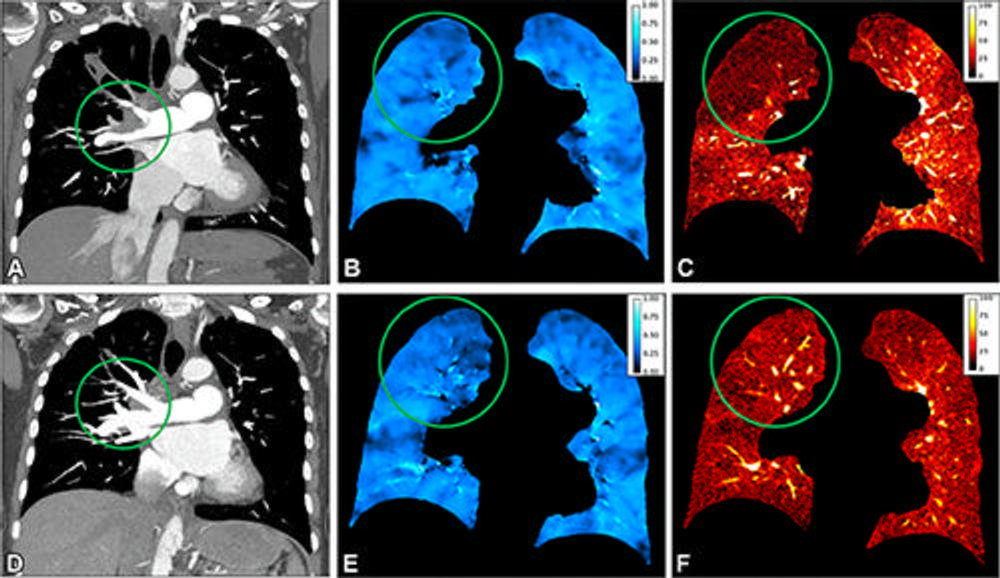
Figure 8. Representative coronal preoperative ventilation-perfusion CT (A–C) and postoperative ventilation-perfusion CT (D–F) images obtained after pulmonary endarterectomy in a 64-year-old female patient with chronic thromboembolic pulmonary hypertension. Circles show pathology. (A) CT angiographic image obtained before surgery shows a wall-adherent thrombus in the central right pulmonary artery extending into the upper lobe artery. (C) Perfusion image shows a corresponding lobar defect in the right upper lobe; region of interest (circle) placed in right upper lobe with a normalized iodine uptake of 4%. (B) Ventilation is homogeneous (region of interest in right upper lobe, 0.46) and preserved at normal level, representing a ventilation/perfusion mismatch. After surgical removal of the thrombus (circle in D), the perfusion in the right upper lobe increased (circle in F; from 4% to 13%), and ventilation remained stable within normal range and comparable before (B) and after (E) surgery.
High-res (TIF) version
(Right-click and Save As)
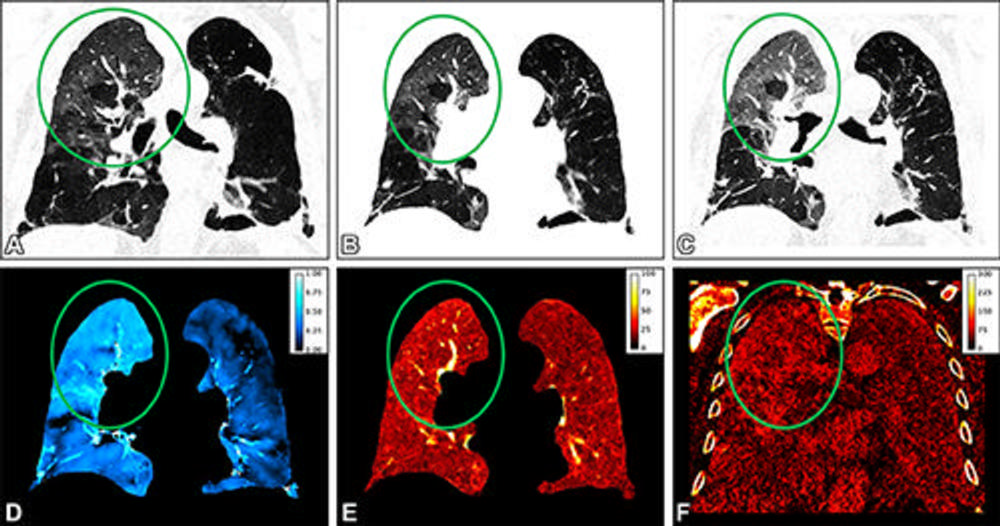
Figure 9. Representative coronal images obtained in an 82-year-old male patient with persisting shortness of breath 1 month after COVID-19 infection. Circles indicate pathology. The virtual noncontrast-enhanced images at (A) inspiration, (B) warped inspiration, and (C) expiration show areas of ground-glass opacifications in the right upper lobe, as well as emphysema in the left lung. The perfusion image (E) and the late enhancement image (F) show corresponding high values with ground-glass opacifications in the affected areas of the lung. (D) The ventilation image is heterogeneous, with areas of low to no ventilation in areas of emphysema, normal ventilation in healthy areas, and increased ventilation (ie, collapse) in the ground-glass opacifications. Exemplary measurements with region of interest in the right upper lobe are as follows: ventilation, 0.61; perfusion, 18% of vessel contrast; and late enhancement, 79% of vessel contrast.
High-res (TIF) version
(Right-click and Save As)
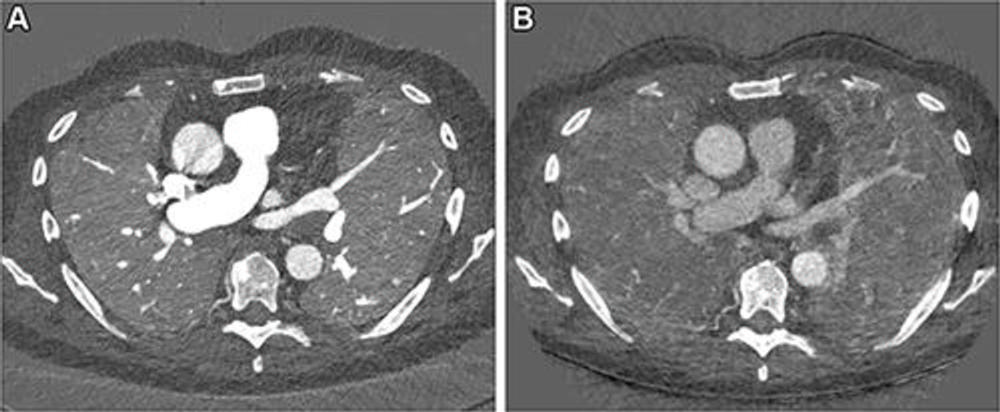
Figure 10. Images in a 67-year-old male patient with slowly progressing idiopathic pulmonary fibrosis. The axial images show differences in the perfusion images generated with (A) photon-counting CT (PCCT) versus (B) standard dual-energy CT. The dose was slightly lower with PCCT (inspiration and expiration, respectively: CT dose index, 3.26 and 3.27 mGy; dose-length product, 126 and 128 mGy ∙ cm) versus dual-energy CT (inspiration and expiration, respectively: CT dose index, 4.52 and 3.28 mGy; dose-length product, 167.6 and 121.5 mGy ∙ cm). The technical advancement of PCCT results in improved spatial and contrast resolution. The faster spectral imaging of PCCT also allows for CT pulmonary angiography in addition to a stable, uniform parenchymal contrast. Furthermore, the morphologic images can be reconstructed with high spatial resolution (1024 × 1024).
High-res (TIF) version
(Right-click and Save As)