AI Helps Detect Pancreatic Cancer
Released: September 13, 2022
At A Glance
- A new deep learning AI tool is effective at identifying pancreatic cancer on CT.
- The tool could help radiologists find the disease at an earlier stage.
- Pancreatic cancer has the lowest five-year survival rate among cancers and is projected to become the second leading cause of cancer death in the U.S. by 2030.
- RSNA Media Relations
1-630-590-7762
media@rsna.org - Linda Brooks
1-630-590-7738
lbrooks@rsna.org - Imani Harris
1-630-481-1009
iharris@rsna.org
OAK BROOK, Ill. — An artificial intelligence (AI) tool is highly effective at detecting pancreatic cancer on CT, according to a study published in Radiology, a journal of the Radiological Society of North America (RSNA).
Pancreatic cancer has the lowest five-year survival rate among cancers. It is projected to become the second leading cause of cancer death in the United States by 2030. Early detection is the best way to improve the dismal outlook, as prognosis worsens significantly once the tumor grows beyond 2 centimeters.

CT is the key imaging method for detection of pancreatic cancer, but it misses about 40% of tumors under 2 centimeters. There is an urgent need for an effective tool to help radiologists in improving pancreatic cancer detection.
Researchers in Taiwan have been studying a computer-aided detection (CAD) tool that uses a type of AI called deep learning to detect pancreatic cancer. They previously showed that the tool could accurately distinguish pancreatic cancer from noncancerous pancreas. However, that study relied on radiologists manually identifying the pancreas on imaging—a labor-intensive process known as segmentation. In the new study, the AI tool identified the pancreas automatically. This is an important advance considering that the pancreas borders multiple organs and structures and varies widely in shape and size.
The researchers developed the tool with an internal test set consisting of 546 patients with pancreatic cancer and 733 control participants. The tool achieved 90% sensitivity and 96% specificity in the internal test set.
Validation followed with a set of 1,473 individual CT exams from institutions throughout Taiwan. The tool achieved 90% sensitivity and 93% specificity in distinguishing pancreatic cancer from controls in that set. Sensitivity for detecting pancreatic cancers less than 2 centimeters was 75%.

"The performance of the deep learning tool seemed on par with that of radiologists," said study senior author Weichung Wang, Ph.D., professor at National Taiwan University and director of the university's MeDA Lab. "Specifically, in this study, the sensitivity of the deep learning computer-aided detection tool for pancreatic cancer was comparable with that of radiologists in a tertiary referral center regardless of tumor size and stage."
The CAD tool has the potential to provide a wealth of information to assist clinicians, Dr. Wang said. It could indicate the region of suspicion to speed radiologist interpretation.
"The CAD tool may serve as a supplement for radiologists to enhance the detection of pancreatic cancer," said the study's co-senior author, Wei-Chi Liao, M.D., Ph.D., from National Taiwan University and National Taiwan University Hospital.
The researchers are planning further studies. In particular, they want to look at the tool's performance in more diverse populations. Since the current study was retrospective, they want to see how it performs going forward in real-world clinical settings.
"Pancreatic Cancer Detection on CT Scans with Deep Learning: A Nationwide Population-based Study." Collaborating with Drs. Wang and Liao were Po-Ting Chen, M.D., Tinghui Wu, M.S., Pochuan Wang, M.S., Dawei Chang, M.S., Kao-Lang Liu, M.D., Ming-Shiang Wu, M.D., Ph.D., Holger Roth, Ph.D., and Po-Chang Lee, M.D.
Radiology is edited by David A. Bluemke, M.D., Ph.D., University of Wisconsin School of Medicine and Public Health, Madison, Wisconsin, and owned and published by the Radiological Society of North America, Inc. (https://pubs.rsna.org/journal/radiology)
RSNA is an association of radiologists, radiation oncologists, medical physicists and related scientists promoting excellence in patient care and health care delivery through education, research and technologic innovation. The Society is based in Oak Brook, Illinois. (RSNA.org)
For patient-friendly information on CT, visit RadiologyInfo.org.
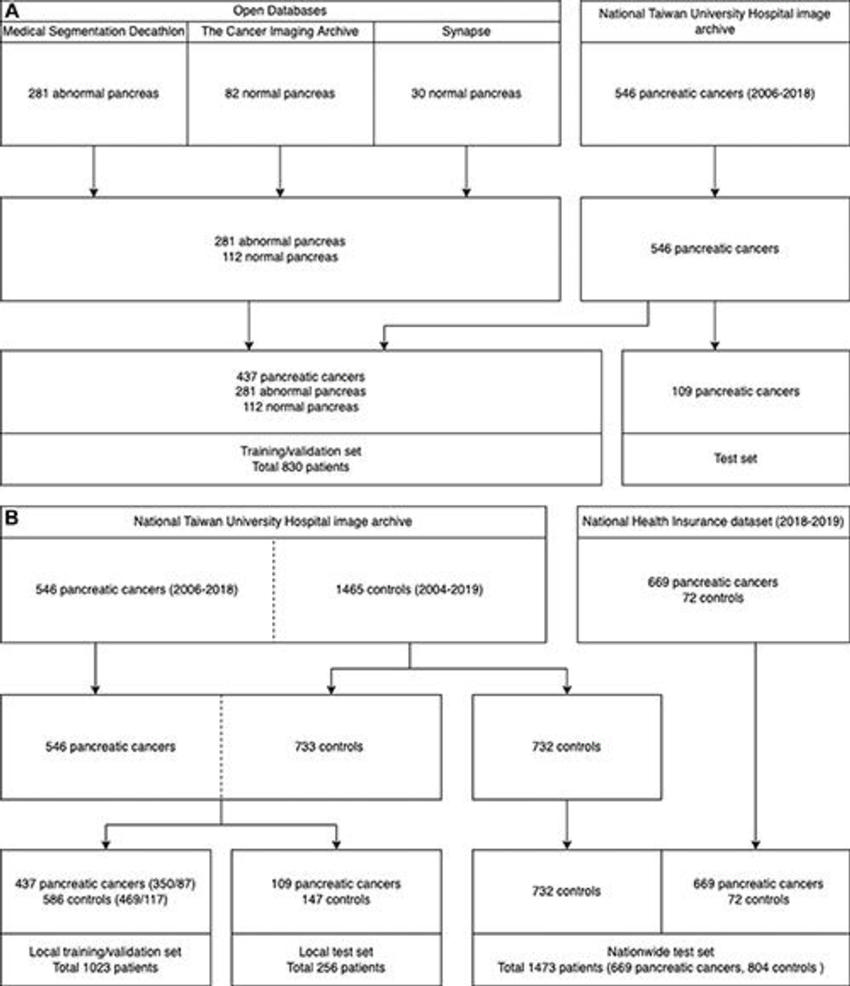
Figure 1. Data sets for the (A) segmentation model and (B) local and nationwide data sets for classification models.
High-res (TIF) version
(Right-click and Save As)
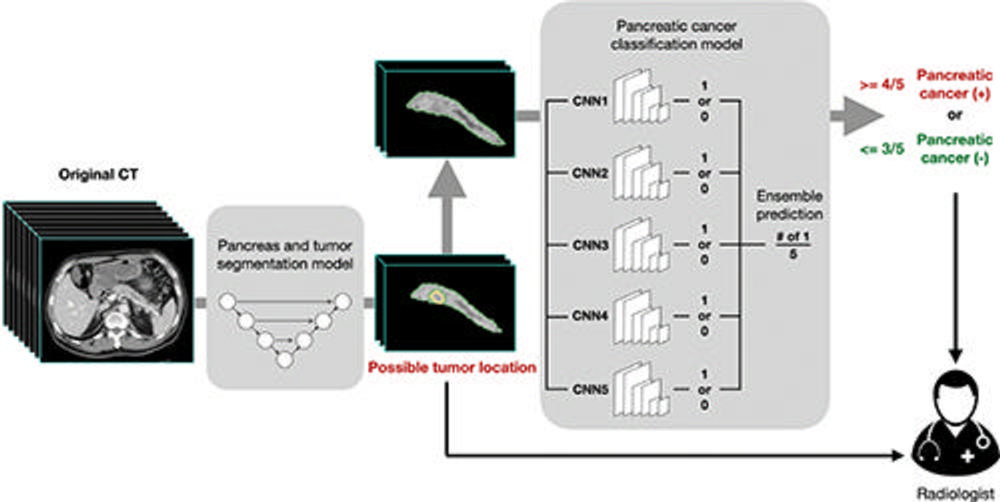
Figure 2. Workflow of the deep learning–based computer-aided detection tool. The segmentation masks passed from the segmentation convolutional neural network (CNN) to the classification CNNs included the pancreas and tumor (if present) combined, without separate delineation or identification between the pancreas and tumor. Solid arrows indicate output of the computer-aided detection tool.
High-res (TIF) version
(Right-click and Save As)
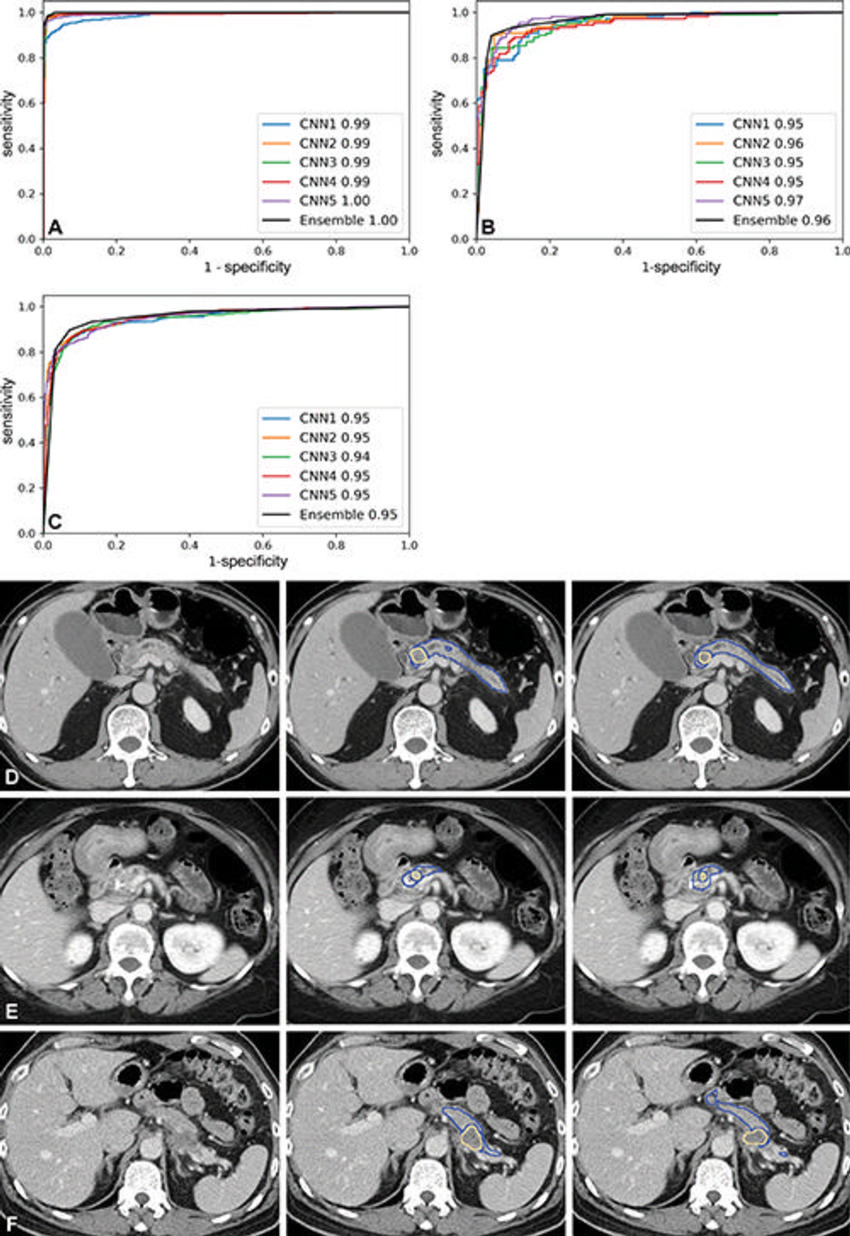
Figure 3. Receiver operating characteristic curves of the classification models in the (A) training and validation set, (B) local test set, and (C) nationwide test set. CNN = convolutional neural network. Representative CT scans (left column) with tumor at the pancreas (D) head, (E) body, and (F) tail show correspondence in tumor location between manual segmentation by radiologists (middle column) and predictions by the segmentation model (right column). Blue outline indicates the pancreas; yellow outline indicates tumor.
High-res (TIF) version
(Right-click and Save As)
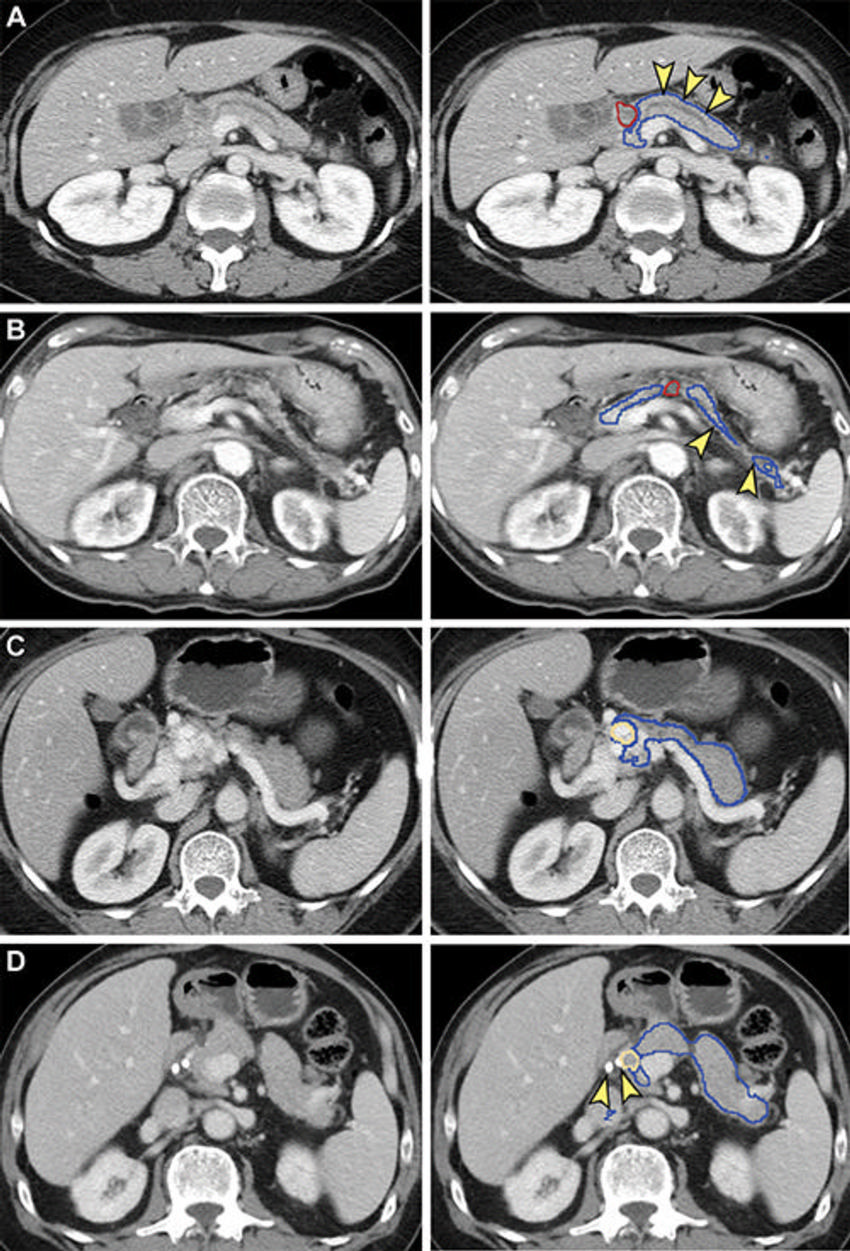
Figure 4. False-negative (A, B) and false-positive (C, D) tumor segmentation by the segmentation model. Blue and yellow outlines indicate normal pancreas and tumor segmented with the segmentation model, respectively. Images in the left column are original unannotated CT scans. (A, B) Tumors (red outline) were not segmented by the segmentation convolutional neural network. The upstream pancreas shows secondary signs of pancreatic cancer, including dilation of the pancreatic duct with abrupt cutoff (arrowhead in A) and parenchymal atrophy with dilation of the pancreatic duct (arrowhead in B). (C) Collateral veins secondary to idiopathic portal vein thrombosis were incorrectly segmented as tumor by the segmentation model. (D) Pancreatic parenchyma adjacent to biliary stents (arrowhead) placed for relieving obstructive jaundice from hepatocellular carcinoma was incorrectly segmented as tumor by the segmentation model.
High-res (TIF) version
(Right-click and Save As)
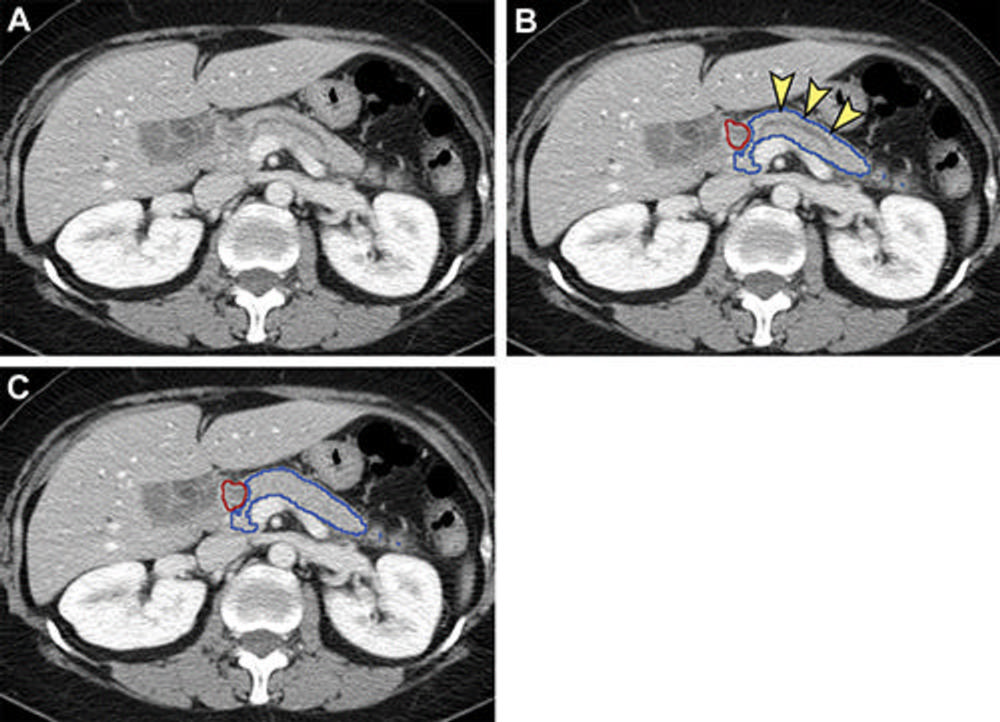
Figure 5. Analysis of nontumorous portion of pancreas with or without secondary signs of pancreatic cancer by classification models. Blue outline represents the portion of the pancreas analyzed with classification models. The tumor (red outline) was not identified by the segmentation model; thus, it was not analyzed by classification models. (A) Unannotated CT image in a patient with pancreatic head cancer. (B) Nontumorous portion of the pancreas shows secondary signs of pancreatic cancer (dilation of pancreatic duct with abrupt cutoff [arrowheads]) and was classified as cancerous by the classification models. (C) Nontumorous portion of the pancreas appeared normal and was classified as noncancerous after the dilated duct was replaced and imputed with surrounding normal-appearing pancreas parenchyma.
High-res (TIF) version
(Right-click and Save As)