AI Can Diagnose Osteoporosis on Hip X-ray
Released: May 25, 2022
At A Glance
- An AI model can automatically diagnose osteoporosis from hip X-rays.
- The researchers used almost 5,000 hip X-rays from 4,308 patients obtained over more than 10 years to develop the model.
- The approach could help speed treatment to patients before fractures occur.
- RSNA Media Relations
1-630-590-7762
media@rsna.org - Linda Brooks
1-630-590-7738
lbrooks@rsna.org - Imani Harris
1-630-481-1009
iharris@rsna.org
OAK BROOK, Ill. (May 25, 2022) — A new method that combines imaging information with artificial intelligence (AI) can diagnose osteoporosis from hip X-rays, according to a study in Radiology: Artificial Intelligence. Researchers said the approach could help speed treatment to patients before fractures occur.

People with osteoporosis, a skeletal disease that thins and weakens bones, are susceptible to fracture associated with bone fragility, resulting in poor quality of life and increased mortality. According to statistics from the International Osteoporosis Foundation, one in three women worldwide over the age of 50 years and one in five men will experience osteoporotic fractures in their lifetime.
Early screening for osteoporosis with dual-energy X-ray absorptiometry (DXA) to assess bone mineral density is an important tool for timely treatment that can reduce the risk of fractures. However, the low availability of the scanners and the relatively high cost has limited its use for screening and post-treatment follow-up.
In contrast, plain X-ray is widely available and is used frequently for various clinical indications in daily practice. Despite these attributes, it has been relatively underutilized in the management of osteoporosis because diagnosing osteoporosis using only X-rays is challenging even for an experienced radiologist.
“For patients with hip pain, radiologists often evaluate only image findings that may cause pain, such as fractures, osteonecrosis and osteoarthritis,” said study author Hee-Dong Chae, M.D., from the Department of Radiology at Seoul National University Hospital in Seoul, Korea. “Although X-ray images contain more information about the healthiness of the patient’s bones and muscles, this information is often overlooked or considered less important.”
Dr. Chae and colleagues developed a model that can automatically diagnose osteoporosis from hip X-rays. The method combines radiomics, a series of image processing and analysis methods to obtain information from the image, with deep learning, an advanced type of AI. Deep learning can be trained to find patterns in images associated with disease.
The researchers developed the deep-radiomics model using almost 5,000 hip X-rays from 4,308 patients obtained over more than 10 years. They developed the models with a variety of deep, clinical and texture features and then tested them externally on 444 hip X-rays from another institution.
The deep-radiomics model with deep, clinical, and texture features was able to diagnose osteoporosis on hip X-rays with superior diagnostic performance than the models using either texture or deep features alone, enabling opportunistic diagnosis of osteoporosis.
“Our study shows that opportunistic detection of osteoporosis using these X-ray images is advantageous, and our model can serve as a triage tool recommending DXA in patients with highly suspected osteoporosis,” Dr. Chae said.
The researchers are planning a larger study that combines the clinical information from Korea’s National Health Insurance Service database with the imaging data of the Seoul University Hospital.
“Deep-Radiomics-Based Approach to the Diagnosis of Osteoporosis Using Hip Radiographs.” Collaborating with Dr. Chae were Sangwook Kim, B.S., Bo Ram Kim, M.D., Jimin Lee, Ph.D., Sung-Joon Ye, Ph.D., Dong Hyun Kim, M.D., Sung Hwan Hong, M.D., Ph.D., Ja-Young Choi, M.D., Ph.D., and Hye Jin Yoo, M.D., Ph.D.
Radiology: Artificial Intelligence is edited by Charles E. Kahn Jr., M.D., M.S., Perelman School of Medicine at the University of Pennsylvania, and owned and published by the Radiological Society of North America, Inc. (https://pubs.rsna.org/journal/ai)
RSNA is an association of radiologists, radiation oncologists, medical physicists and related scientists promoting excellence in patient care and health care delivery through education, research and technologic innovation. The Society is based in Oak Brook, Illinois. (RSNA.org)
For information on musculoskeletal imaging, visit RadiologyInfo.org.
Images (JPG, TIF):
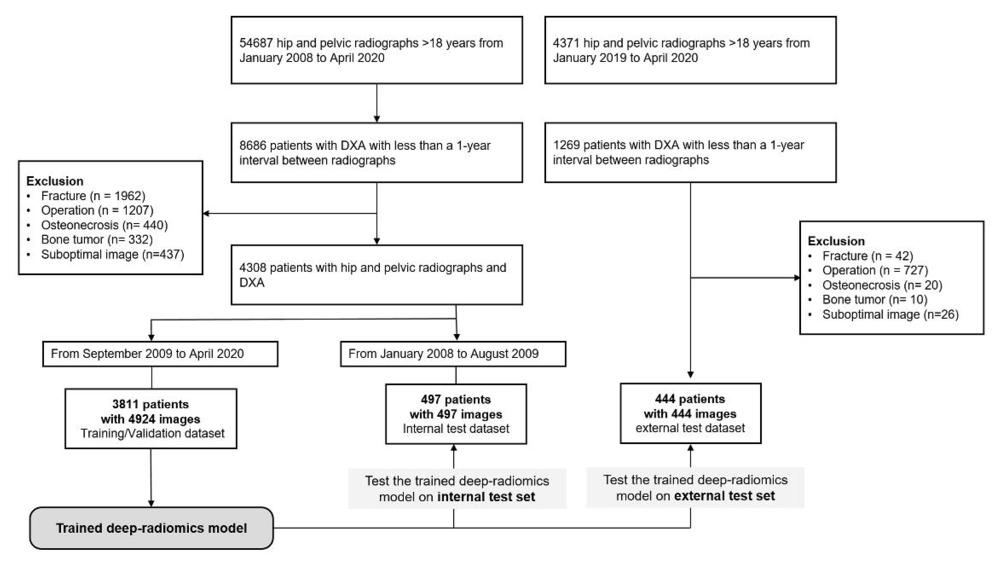
Figure 1. Flow diagram of data inclusion and allocation. DXA = dual-energy x-ray absorptiometry.
High-res (TIF) version
(Right-click and Save As)
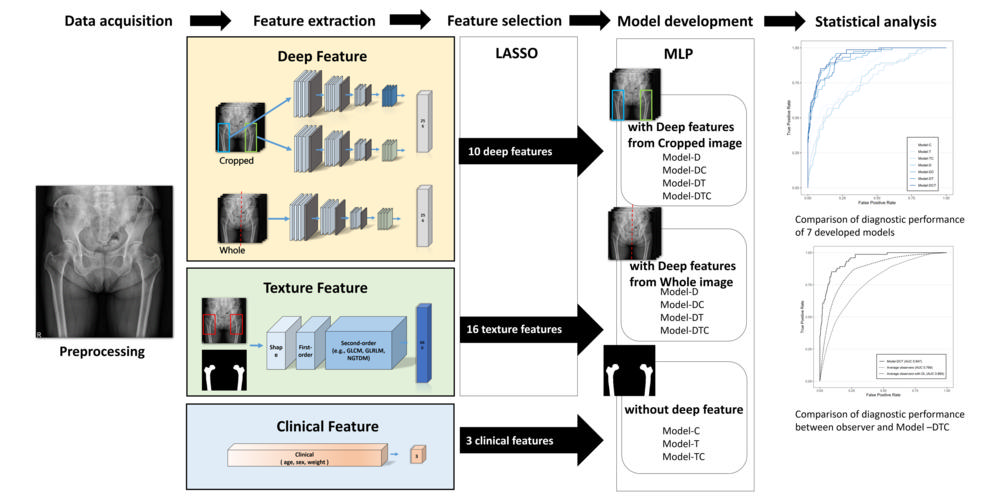
Figure 2. Flow diagram for feature selection and deep-radiomics model development. LASSO = least absolute shrinkage and selection operator, MLP = multilayer perceptron, Model-C = model with clinical features, Model-T = model with texture features, Model-TC = model with texture and clinical features, Model-D = model with deep features, Model-DC = model with deep and clinical features, Model-DT = model with deep and texture features, Model-DTC = model with deep, clinical, and texture features.
High-res (TIF) version
(Right-click and Save As)
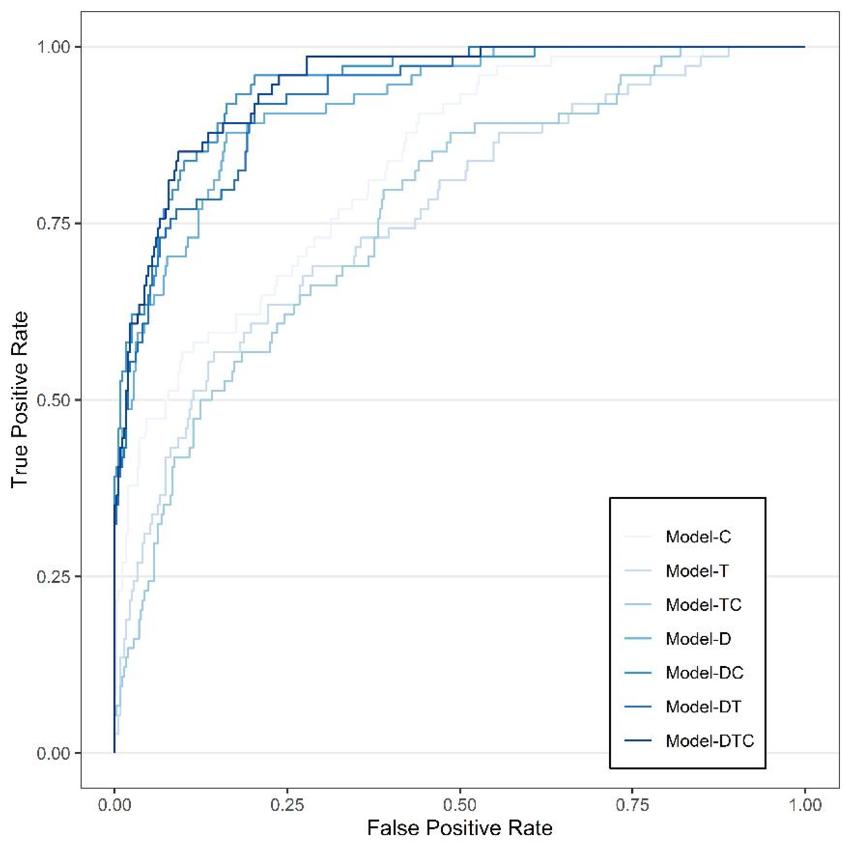
Figure 3. Diagnostic Performance of Deep-Radiomics Models and Observers. Seven deep-radiomics models with different feature combinations showed high diagnostic performance in the external test sets (AUC 0.77–0.95). The deep-radiomics model with clinical and texture features (Model-DTC) showed superior diagnostic performance among the seven different models in the external test set.
High-res (TIF) version
(Right-click and Save As)
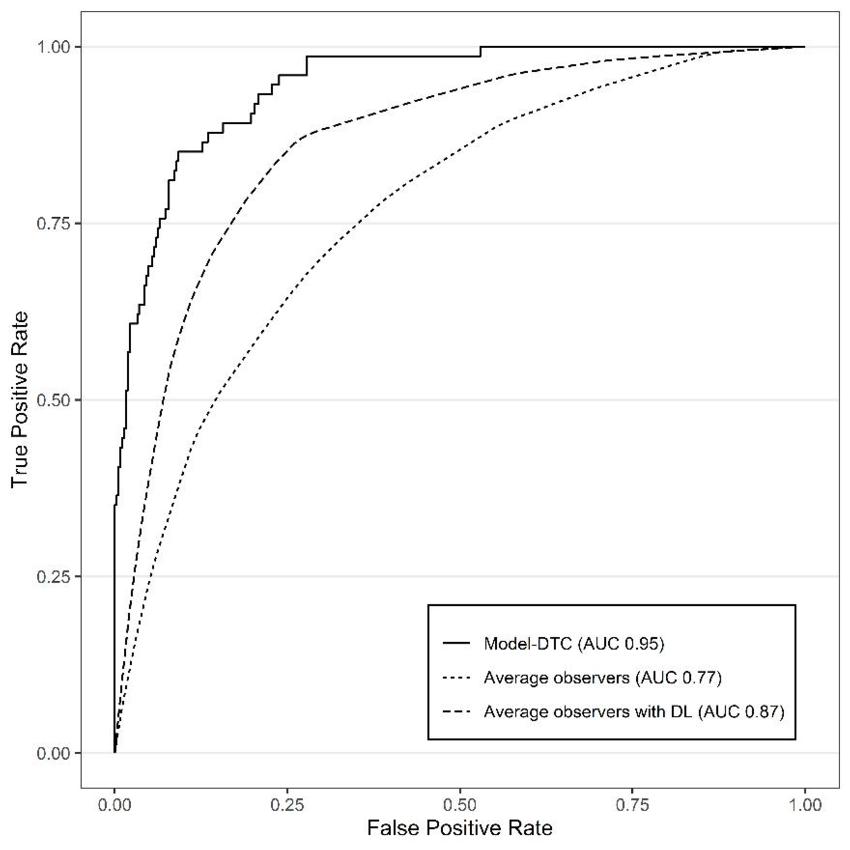
Figure 4. Diagnostic Performance of Deep-Radiomics Models and Observers. In a comparison between diagnostic performance of Model-DTC and observers in the external test set, Model-DTC showed significantly superior performance, even when observers evaluated the image by referring to the prediction of Model-DTC (AUC 0.95 versus 0.87; P = .001).
High-res (TIF) version
(Right-click and Save As)
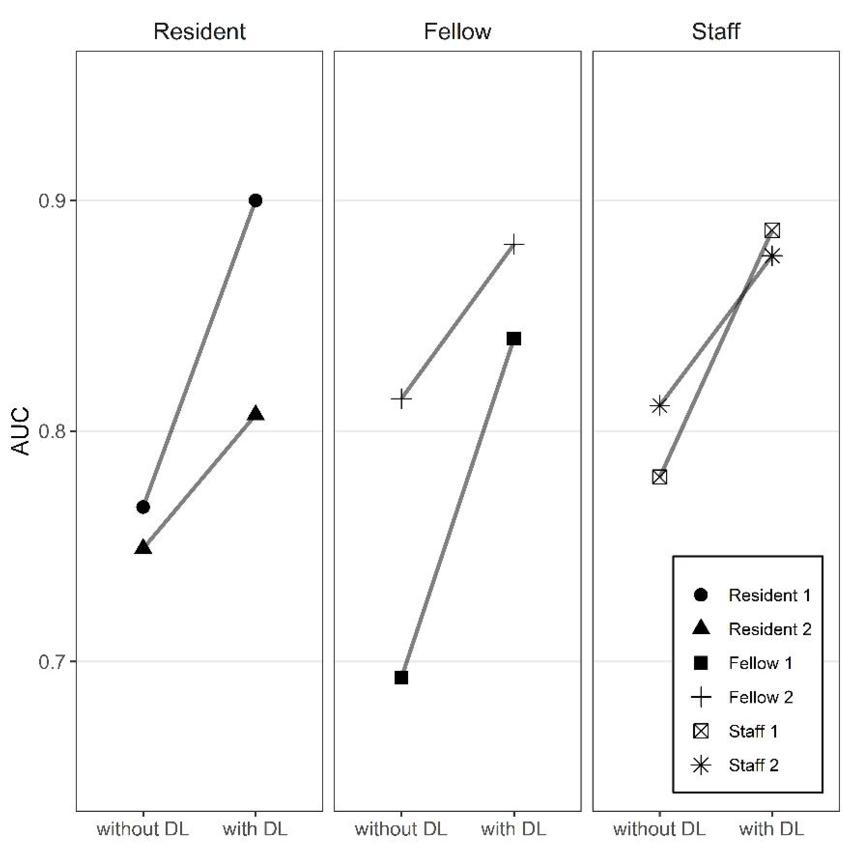
Figure 5. Diagnostic Performance of Deep-Radiomics Models and Observers. In the subgroup analysis according to level of experience, all three groups of observers showed higher diagnostic performance by referring to the Model–DTC prediction results. AUC = area under the curve, DL = deep learning, Model-C = model with clinical features, Model-T = model with texture features, Model-D = model with deep features, Model-DC = model with deep and clinical features, Model-DTC = model with deep, clinical, and texture features.
High-res (TIF) version
(Right-click and Save As)
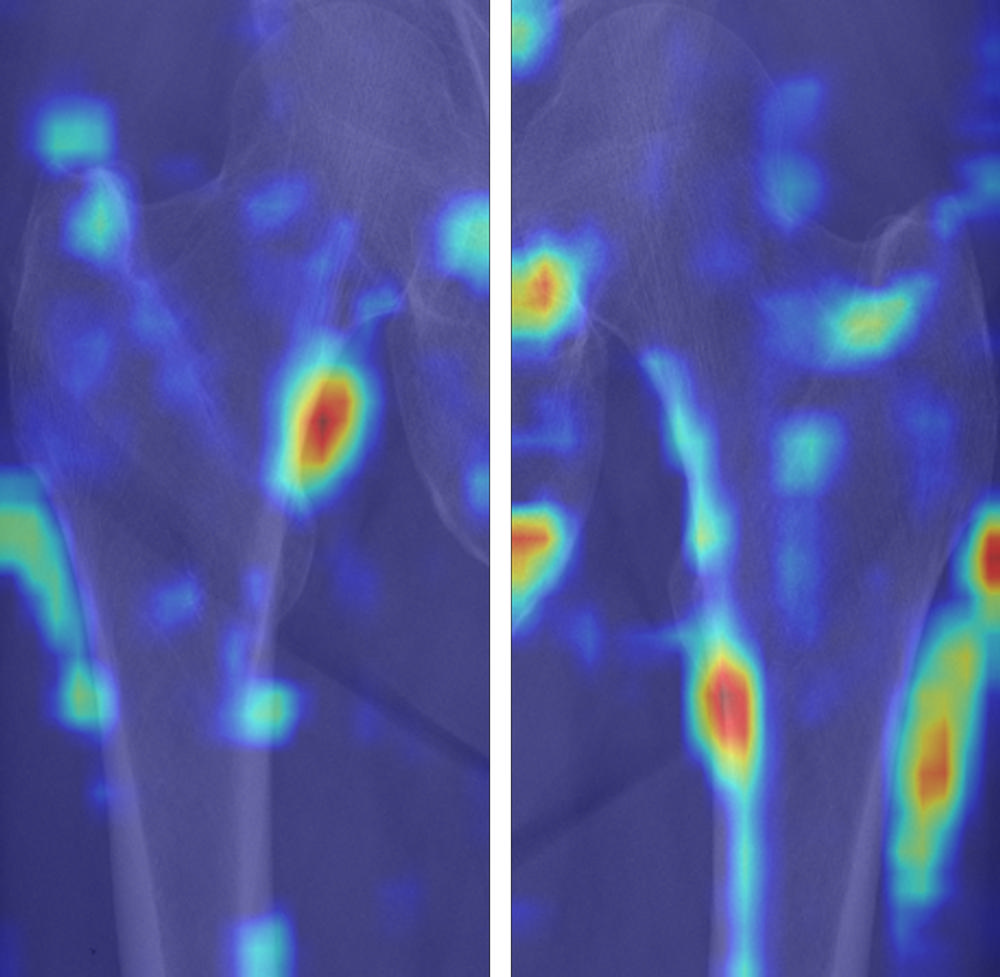
Figure 6. Gradient-weighted class activation mapping (Grad-CAM) images of true-positive cases for diagnosis of osteoporosis. True-positive cases highlighted the medial cortex and lateral surrounding soft tissue area, which reflect the cortical thinning and incremental role of surrounding soft tissue for predicting osteoporosis. We used the jet colormap scale, where the red color stands for high relevance, yellow for medium relevance, and blue for low relevance.
High-res (TIF) version
(Right-click and Save As)
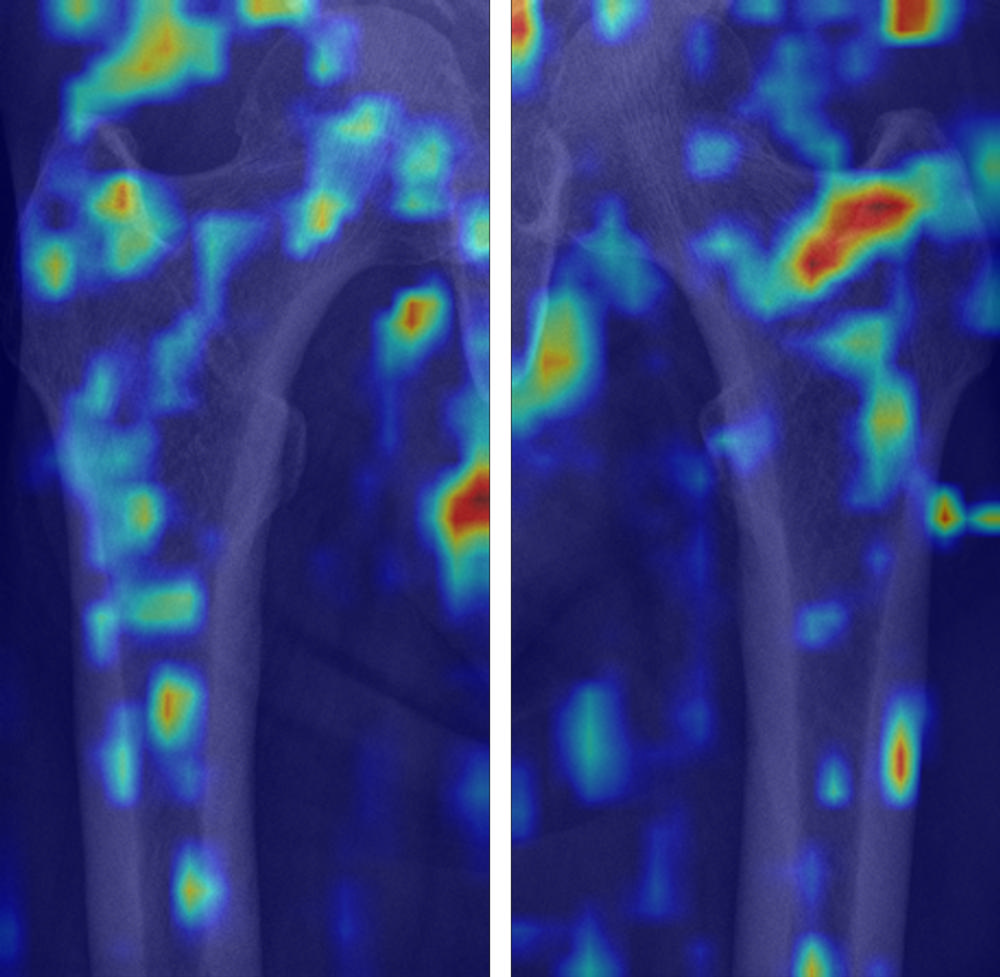
Figure 7. Gradient-weighted class activation mapping (Grad-CAM) images of true-negative cases for diagnosis of osteoporosis. True-negative cases dominantly demonstrated scattered color distribution on the trabecula of proximal femur. We used the jet colormap scale, where the red color stands for high relevance, yellow for medium relevance, and blue for low relevance.
High-res (TIF) version
(Right-click and Save As)
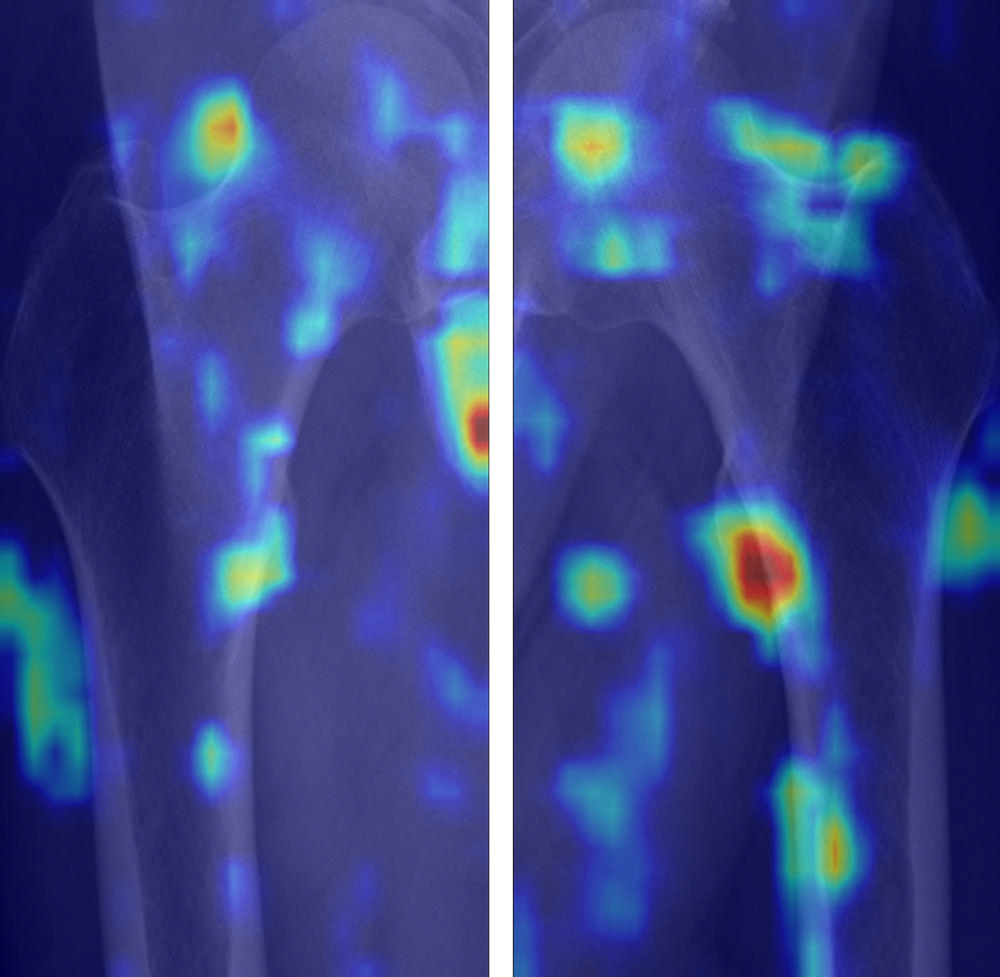
Figure 8. Gradient-weighted class activation mapping (Grad-CAM) images of false-positive cases for diagnosis of osteoporosis. False-positive cases highlighted the medial cortex and lateral surrounding soft tissue area, which reflect the cortical thinning and incremental role of surrounding soft tissue for predicting osteoporosis. We used the jet colormap scale, where the red color stands for high relevance, yellow for medium relevance, and blue for low relevance.
High-res (TIF) version
(Right-click and Save As)
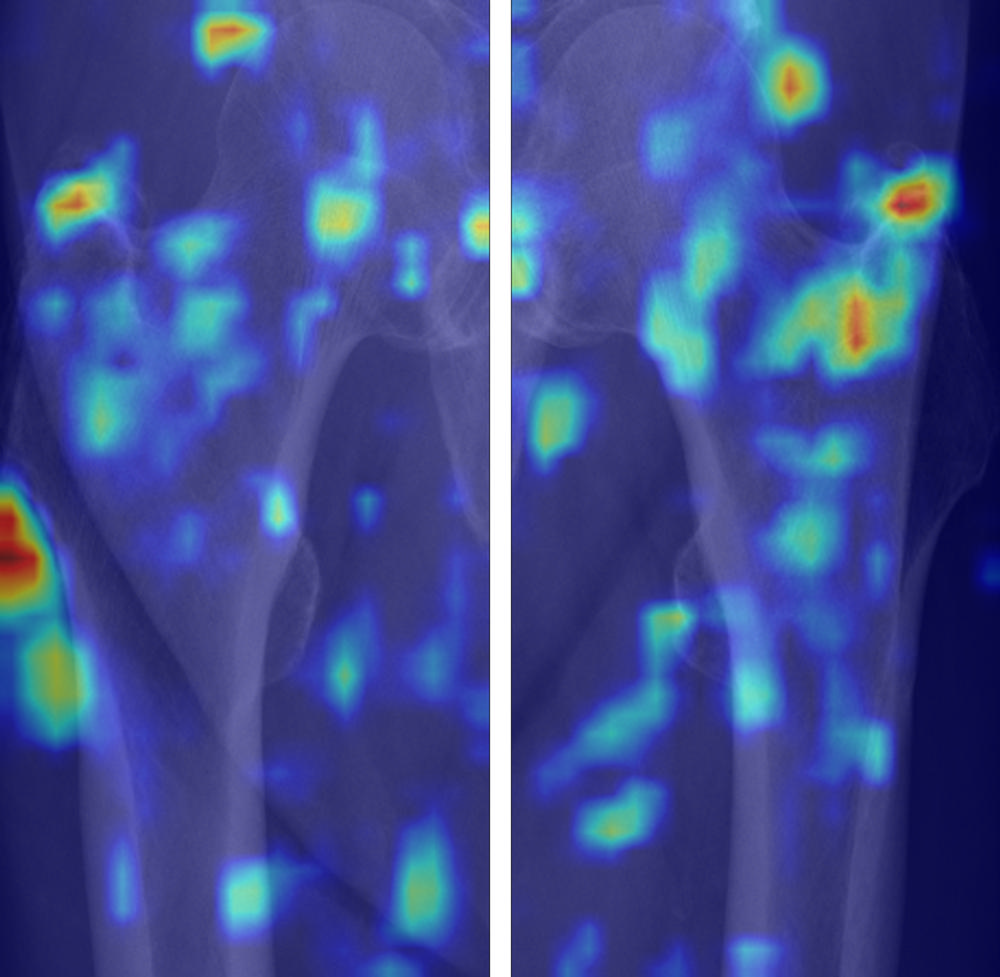
Figure 9. Gradient-weighted class activation mapping (Grad-CAM) images of false-negatives cases for diagnosis of osteoporosis. False-negative cases dominantly demonstrated scattered color distribution on the trabecula of proximal femur. We used the jet colormap scale, where the red color stands for high relevance, yellow for medium relevance, and blue for low relevance.
High-res (TIF) version
(Right-click and Save As)