Researchers Use AI to Predict Cancer Risk of Lung Nodules
Released: May 24, 2022
At A Glance
- An AI tool improves estimation of the cancer risk in lung nodules seen on chest CT.
- Chest CTs were evaluated by radiologists and pulmonologists who made estimates of malignancy risk for nodules using CT imaging data alone and with the AI tool.
- Radiologist and pulmonologist estimations were reasonably accurate but improved when the AI algorithm was added.
- RSNA Media Relations
1-630-590-7762
media@rsna.org - Linda Brooks
1-630-590-7738
lbrooks@rsna.org - Imani Harris
1-630-481-1009
iharris@rsna.org
OAK BROOK, Ill. — An artificial intelligence (AI) tool helps doctors predict the cancer risk in lung nodules seen on CT, according to a new study published in the journal Radiology.
Pulmonary nodules appear as small spots on the lungs on chest imaging. They have become a much more common finding as CT has gained favor over X-rays for chest imaging.

“A nodule would appear on somewhere between 5% to 8% of chest X-rays,” said study senior author Anil Vachani, M.D., director of clinical research in the section of Interventional Pulmonology and Thoracic Oncology at the Perelman School of Medicine, University of Pennsylvania in Philadelphia. “Chest CT is such a sensitive test, you’ll see a small nodule in upwards of a third to a half of cases. We’ve gone from a problem that was relatively uncommon to one that affects 1.6 million people in the U.S. every year.”
Dr. Vachani and colleagues evaluated an AI-based computer-aided diagnosis tool developed by Optellum Ltd. of Oxford, England, to assist clinicians in assessing pulmonary nodules on chest CT. While CT scans show many aspects of the nodule, such as size and border characteristics, AI can delve even deeper.
“AI can go through very large datasets to come up with unique patterns that can’t be seen through the naked eye and end up being predictive of malignancy,” Dr. Vachani said.
In the study, six radiologists and six pulmonologists made estimates of malignancy risk for nodules using CT imaging data alone. They also made management recommendations such as CT surveillance or a diagnostic procedure for each case without and with the AI tool.
A total of 300 chest CTs of indeterminant pulmonary nodules were used in the study. The researchers defined indeterminant nodules as those between 5 and 30 millimeters in diameter.
Analysis showed that use of the AI tool improved estimation of nodule malignancy risk on chest CT. It also improved agreement among the different readers for both risk stratification and management recommendations.
“The readers judge malignant or benign with a reasonable level of accuracy based on imaging itself, but when you combine their clinical interpretation with the AI algorithm, the accuracy level improves significantly,” Dr. Vachani said. “The level of improvement suggests that this tool has the potential to change how we judge cancer versus benign and hopefully improve how we manage patients.”
The model appears to work equally well on diagnostic CT and low-dose screening CT, Dr. Vachani said, but more study is needed before the AI tool can be used in the clinic.
“We’ve taken the first step here and shown that decision making is better if the AI tool is incorporated into radiology or pulmonology practice,” Dr. Vachani said. “The next step is to take the tool and do some prospective trials where physicians use the AI tool in a real-world setting. We are in the process of designing those trials.”
“Artificial Intelligence Tool for Assessment of Indeterminate Pulmonary Nodules Detected with CT.” Collaborating with Dr. Vachani were Roger Y. Kim, M.D., M.S.C.E., Jason L. Oke, M.Sc., D.Phil., Lyndsey C. Pickup, D.Phil., Reginald F. Munden, M.D., D.M.D., M.B.A., Travis L. Dotson, M.D., Christina R. Bellinger, M.D., Avi Cohen, M.D., Michael J. Simoff, M.D., Pierre P. Massion, M.D., Claire Filippini, M.B.Ch.B., and Fergus V. Gleeson, Ph.D., FRCP, FRCR.
Radiology is edited by David A. Bluemke, M.D., Ph.D., University of Wisconsin School of Medicine and Public Health, Madison, Wisconsin, and owned and published by the Radiological Society of North America, Inc. (https://pubs.rsna.org/journal/radiology)
RSNA is an association of radiologists, radiation oncologists, medical physicists and related scientists promoting excellence in patient care and health care delivery through education, research and technologic innovation. The Society is based in Oak Brook, Illinois. (RSNA.org)
For patient-friendly information on chest CT, visit RadiologyInfo.org.
Images (JPG, TIF):
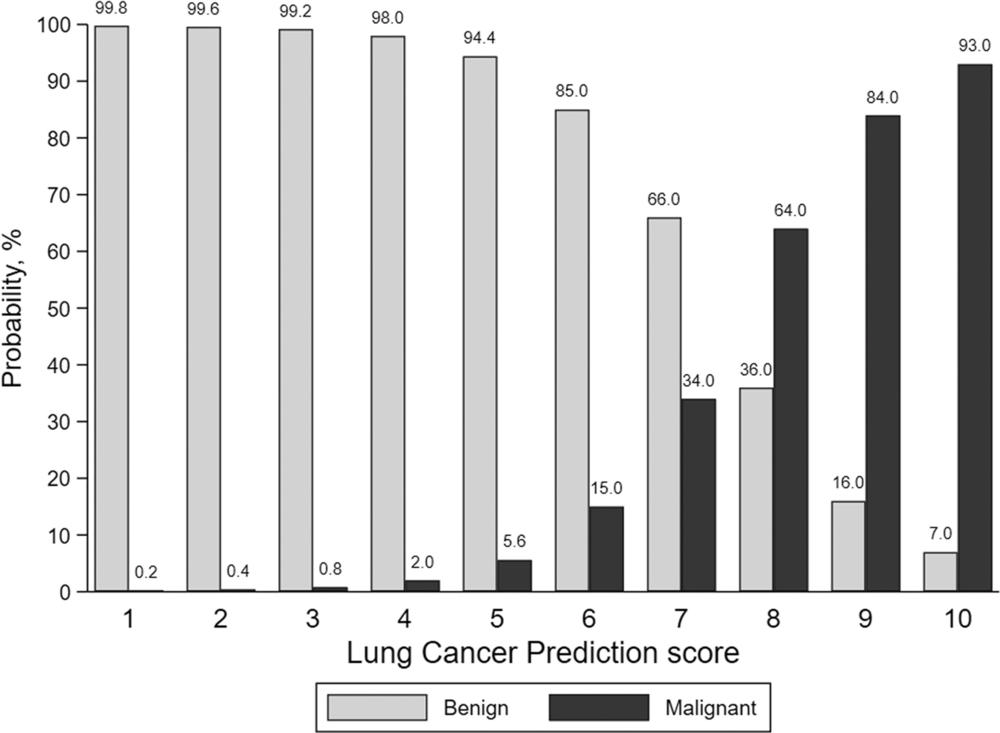
Figure 1. The lung cancer prediction score is generated by an artificial intelligence tool and categorizes pulmonary nodule malignancy risk on a decile scale, with a score of 1 representing nodules at lowest risk and a score of 10 indicating nodules at highest risk.
High-res (TIF) version
(Right-click and Save As)
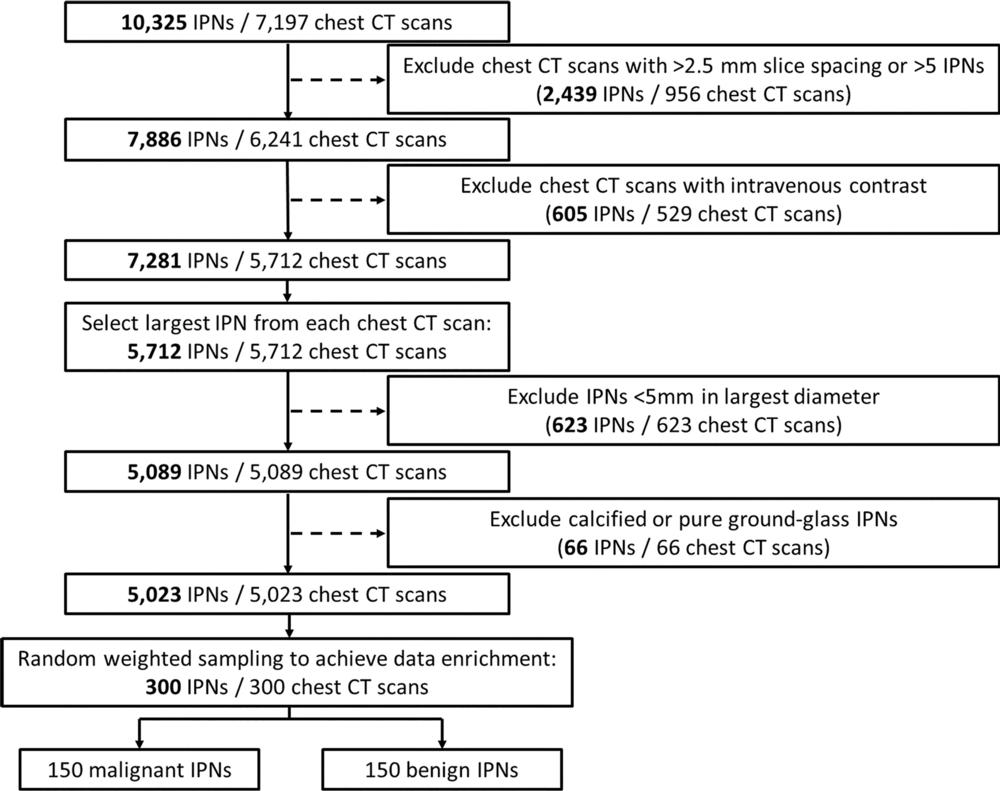
Figure 2. Flowchart shows inclusion and exclusion criteria for pulmonary nodules included in the study. IPNs = indeterminate pulmonary nodules.
High-res (TIF) version
(Right-click and Save As)
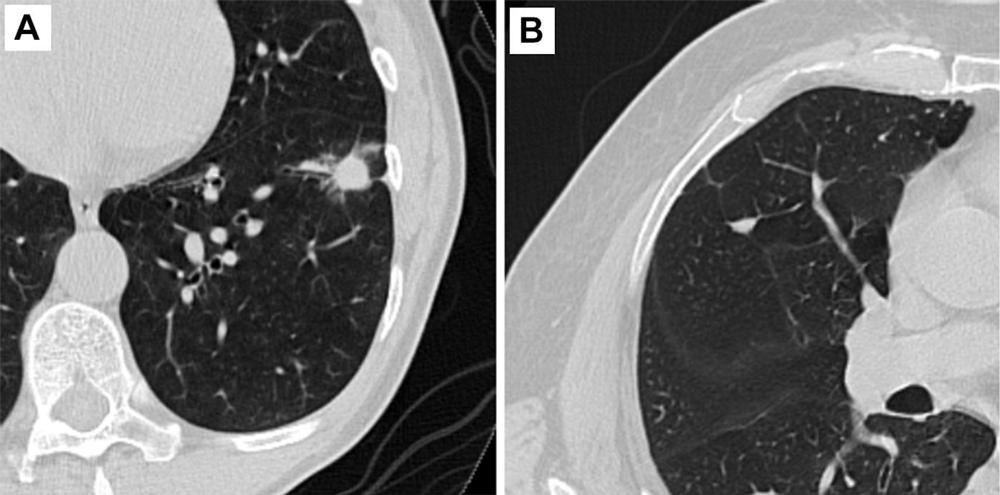
Figure 3. Representative axial CT images of pulmonary nodules included in the study. (A) Malignant nodule with a lung cancer prediction score of 10. (B) Benign nodule with a lung cancer prediction score of 2.
High-res (TIF) version
(Right-click and Save As)
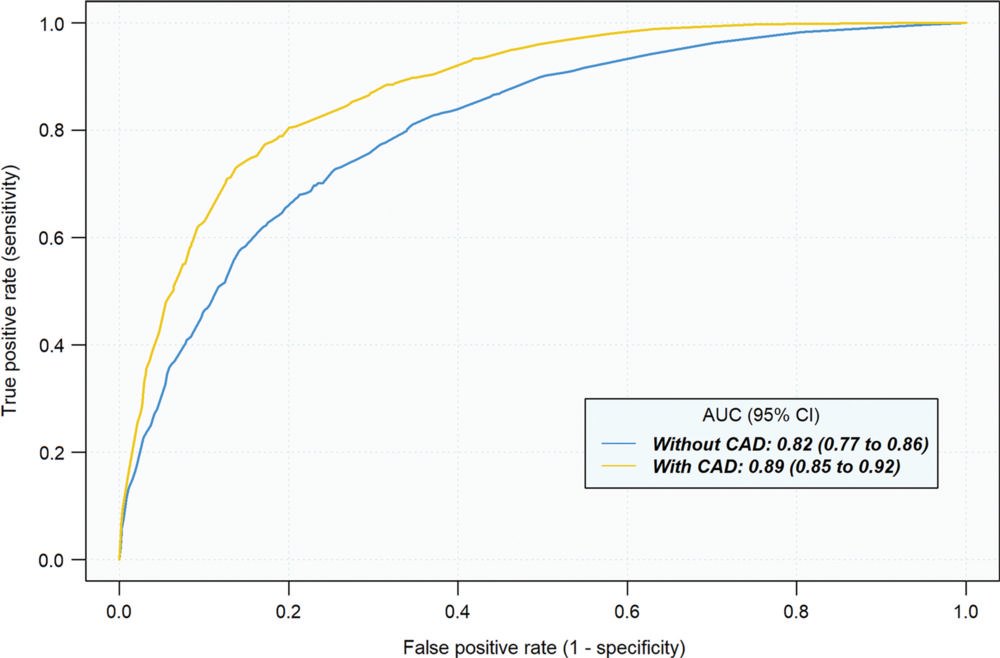
Figure 4. Average reader receiver operating characteristic curves for discrimination of indeterminate pulmonary nodules under two reading conditions: without computer-aided diagnosis (CAD) and with CAD. Average area under the receiver operating characteristic curve (AUC) was computed across 12 readers participating in the study using either the Obuchowski-Rockette and Dorfman-Berbaum-Metz method, which accounts for the multireader multicase study design.
High-res (TIF) version
(Right-click and Save As)
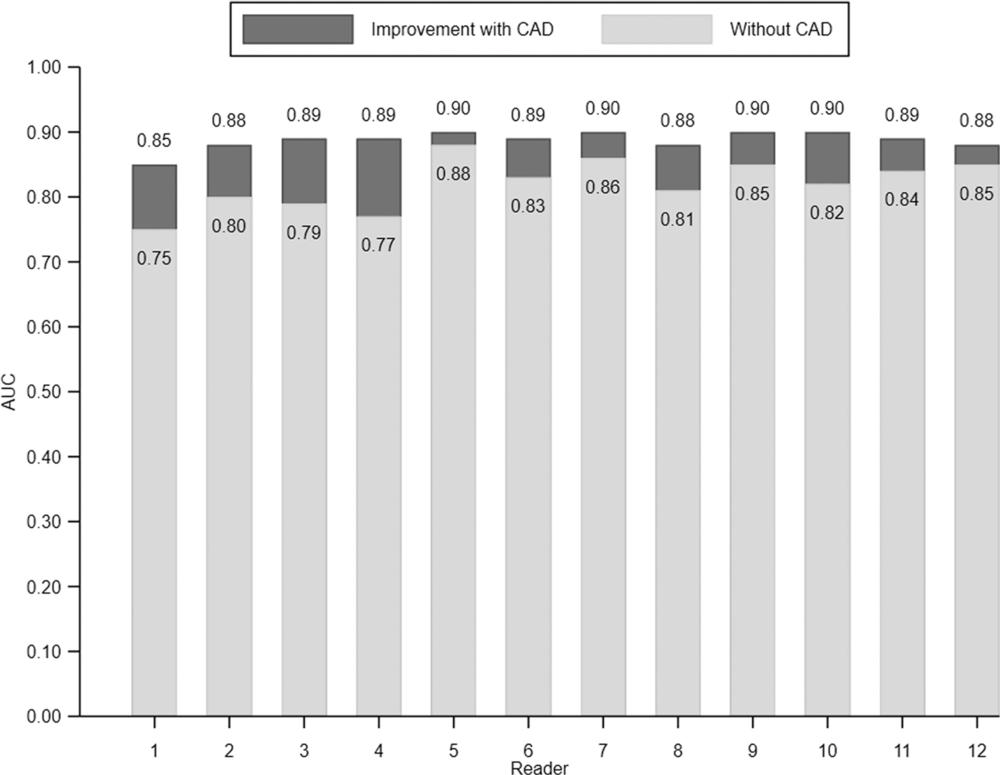
Figure 5. Individual reader discrimination under two reading conditions: without computer-aided diagnosis (CAD) and with CAD. There was a significant improvement in area under the receiver operating characteristic curve (AUC) for each reader (P ≤ .001) with CAD.
High-res (TIF) version
(Right-click and Save As)
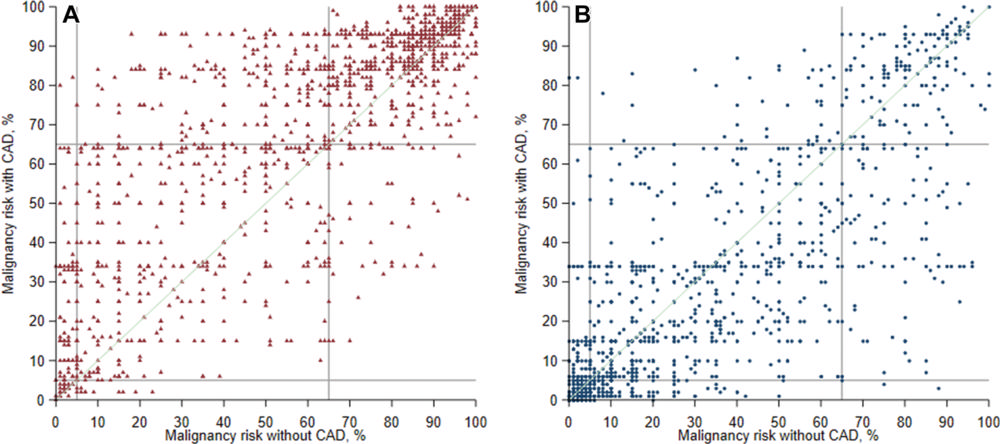
Figure 6. Reclassification plots with and without computer-aided diagnosis (CAD) for malignant and benign pulmonary nodules. Summary plots of all pairs of pre-CAD (x-axis) and post-CAD (y-axis) malignancy risk estimates for malignant (n = 1800 [150 cases × 12 readers]) (A) and benign (n = 1800 [150 cases × 12 readers]) (B) nodules. Malignancy risk decision thresholds of 5% and 65% are depicted as gray lines in each plot.
High-res (TIF) version
(Right-click and Save As)