‘Long COVID’ Linked to Lasting Airways Disease
Released: March 15, 2022
At A Glance
- Air trapping, indicative of small airways disease, was found in patients with lingering respiratory symptoms after COVID-19 infection.
- Air trapping is a condition in which people are not able to empty their lungs when they breathe out.
- The percentage of lung affected by air trapping was similar across COVID-19 severity groups and persisted in 8 of 9 participants who were imaged more than 200 days after diagnosis.
- RSNA Media Relations
1-630-590-7762
media@rsna.org - Linda Brooks
1-630-590-7738
lbrooks@rsna.org - Imani Harris
1-630-481-1009
iharris@rsna.org
OAK BROOK, Ill. — Disease of the small airways in the lungs is a potential long-lasting effect of COVID-19, according to a new study published in the journal Radiology. The study found that small airways disease occurred independently of initial infection severity. The long-term consequences are unknown.

“There is some disease happening in the small airways independent of the severity of COVID-19,” said study senior author Alejandro P. Comellas, M.D., professor of internal medicine and faculty in the Division of Pulmonary and Critical Care Medicine at the Carver College of Medicine, University of Iowa in Iowa City. “We need to investigate further to see whether it is transient or more permanent.”
Early reports indicate that more than 50% of adult survivors of SARS-CoV-2 infection experience post-acute sequelae of COVID-19 (PASC), more commonly known as “long COVID.” Respiratory symptoms, including cough and dyspnea, are reported by nearly 30% of patients with long COVID, including those who experienced mild infection.
The study grew out of observations from University of Iowa clinicians that many patients with initial SARS-CoV-2 infection who were either hospitalized or treated in the ambulatory setting later showed signs of chronic lung disease such as shortness of breath and other respiratory symptoms.
Dr. Comellas and colleagues put a protocol in place to perform both inspiratory and expiratory CT in these patients. Inspiratory CT, performed after patients inhale, is the standard imaging technique for viewing lung tissue, but post-exhalation expiratory scans are needed to assess air trapping, a condition in which people are not able to empty their lungs when they breathe out. Air trapping is found in many obstructive airway diseases, such as asthma and chronic obstructive pulmonary disease (COPD).
For the study, the researchers compared CT findings in people who had COVID-19 and persistent symptoms with those of a healthy control group. They enrolled 100 adults with confirmed COVID-19 who had remained symptomatic more than 30 days following diagnosis, along with 106 healthy participants. The 100 COVID-19 survivors, median age 48 years, included 67 who were classified as ambulatory, or not requiring hospitalization, 17 who were hospitalized, and 16 who required care in the intensive care unit (ICU) during acute infection.
The researchers detected air trapping on expiratory chest CT images in the COVID-19 group. The mean percentage of total lung affected by air trapping ranged from slightly more than 25% in the ambulatory group to almost 35% in the hospitalized group, compared with only 7.2% in healthy controls. Air trapping persisted in eight of the nine participants who underwent imaging more than 200 days after diagnosis.
These imaging results show a high prevalence of long-lasting air trapping, regardless of the initial severity of infection.
Quantitative analysis of expiratory chest CT images, performed with the help of a sophisticated type of artificial intelligence known as supervised machine learning, showed evidence of small airways disease. While small airways disease is not fully understood, evidence suggests it may be related to either inflammation or remodeling of the small airways that prevents air from being able to be exhaled from the lungs.
“For the first time, we’re describing small airways disease in this population of COVID-19 patients with persistent symptoms,” Dr. Comellas said. “Something is going on in the distal airways related to either inflammation or fibrosis that is giving us a signal of air trapping.”
The median time from diagnosis to chest CT imaging was approximately 75 days. The researchers noted that persistence of respiratory abnormalities in this timeframe raises concern for permanent airway remodeling and fibrosis following SARS-CoV-2 infection.
Dr. Comellas and colleagues intend to follow the patients in the study registry and see how many improve and recover and how many remain with abnormal findings.
“If a portion of patients continues to have small airways disease, then we need to think about the mechanisms behind it,” he said. “It could be something related to inflammation that’s reversible, or it may be something related to a scar that is irreversible, and then we need to look at ways to prevent further progression of the disease.”
“Quantitative Chest CT Assessment of Small Airways Disease in Post-Acute SARS-CoV-2 Infection.” Collaborating with Dr. Comellas were Josalyn L. Cho, M.D., Raul A. Villacreses, M.D., Prashant Nagpal, M.D., Junfeng Guo, Ph.D., Alejandro A. Pezzulo, M.D., Andrew L. Thurman, Ph.D., Nabeel Y. Hamzeh, M.D., Robert J. Blount, M.D., M.A.S., Spyridon Fortis, M.D., Eric A. Hoffman, Ph.D., and Joseph Zabner, M.D.
Radiology is edited by David A. Bluemke, M.D., Ph.D., University of Wisconsin School of Medicine and Public Health, Madison, Wisconsin, and owned and published by the Radiological Society of North America, Inc. (https://pubs.rsna.org/journal/radiology)
RSNA is an association of radiologists, radiation oncologists, medical physicists and related scientists promoting excellence in patient care and health care delivery through education, research and technologic innovation. The Society is based in Oak Brook, Illinois. (RSNA.org)
For patient-friendly information on chest CT, visit RadiologyInfo.org.
Images (JPG, TIF):
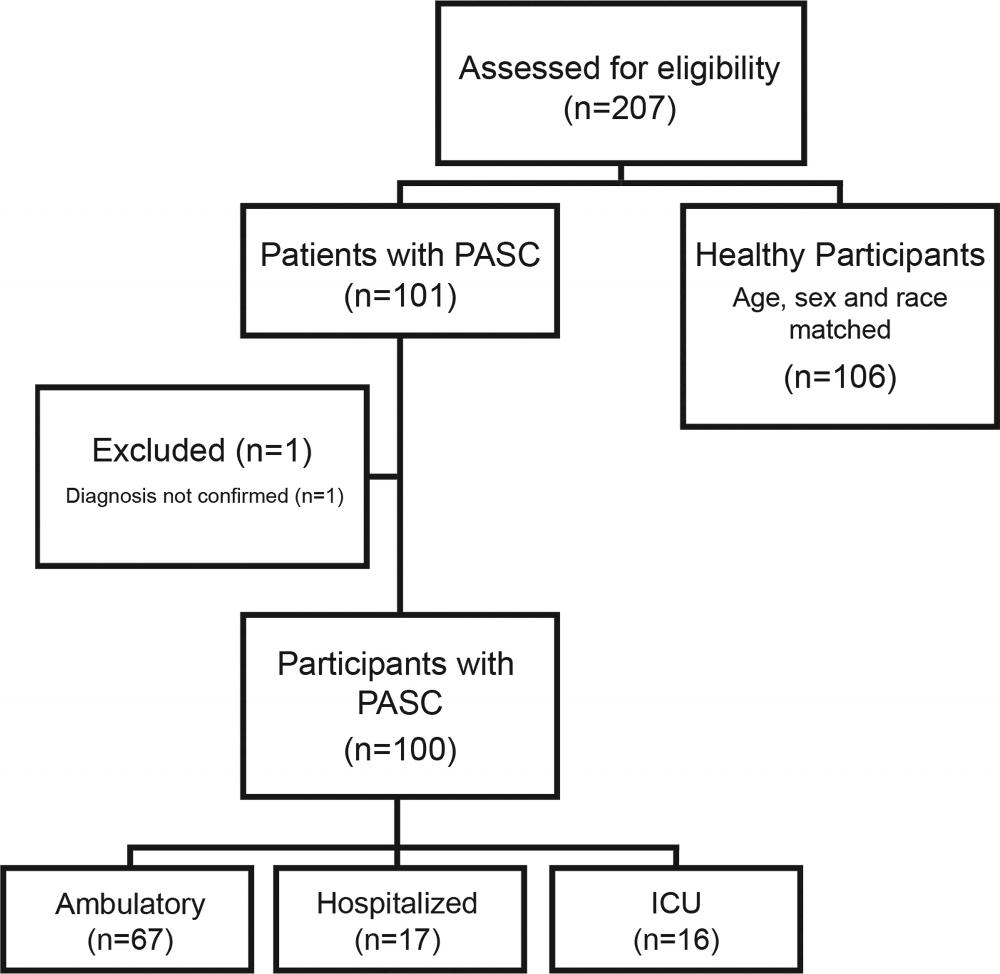
Figure 1. Flow chart of study participants. PASC = post-acute sequela of COVID-19; ICU = intensive care unit
High-res (TIF) version
(Right-click and Save As)
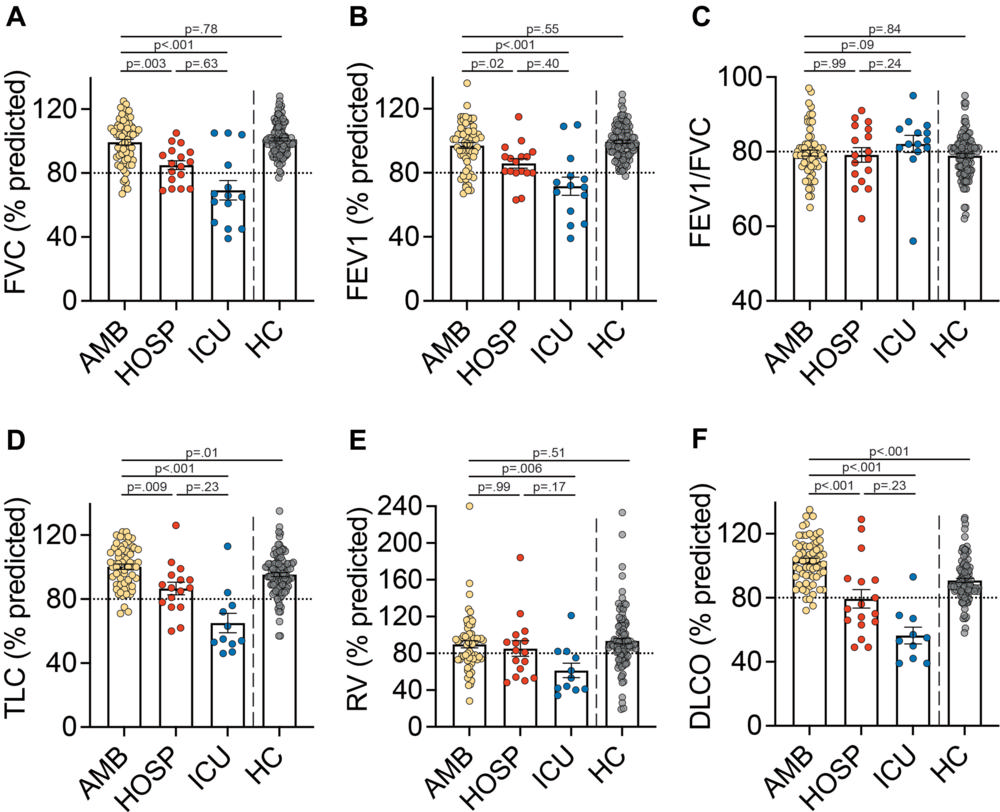
Figure 2. Pulmonary function testing in post-acute COVID-19. Shown are the pulmonary function testing data by group. (A) Percent predicted forced vital capacity (FVC). (B) Percent predicted forced expiratory volume in 1 second (FEV1). (C) FEV1/FVC. (D) Percent predicted total lung capacity (TLC). (E) Percent predicted residual volume (RV). (F) Percent predicted diffusing capacity of the lung for carbon monoxide (DLCO). Data are displayed as mean with standard error measurement (SEM). Horizontal dashed lines indicate the lower limit of normal. P values calculated using Dunn’s test for post-hoc comparisons between groups. Abbreviations: AMB, ambulatory; HOSP, hospitalized; ICU, intensive care unit; HC, healthy controls
High-res (TIF) version
(Right-click and Save As)
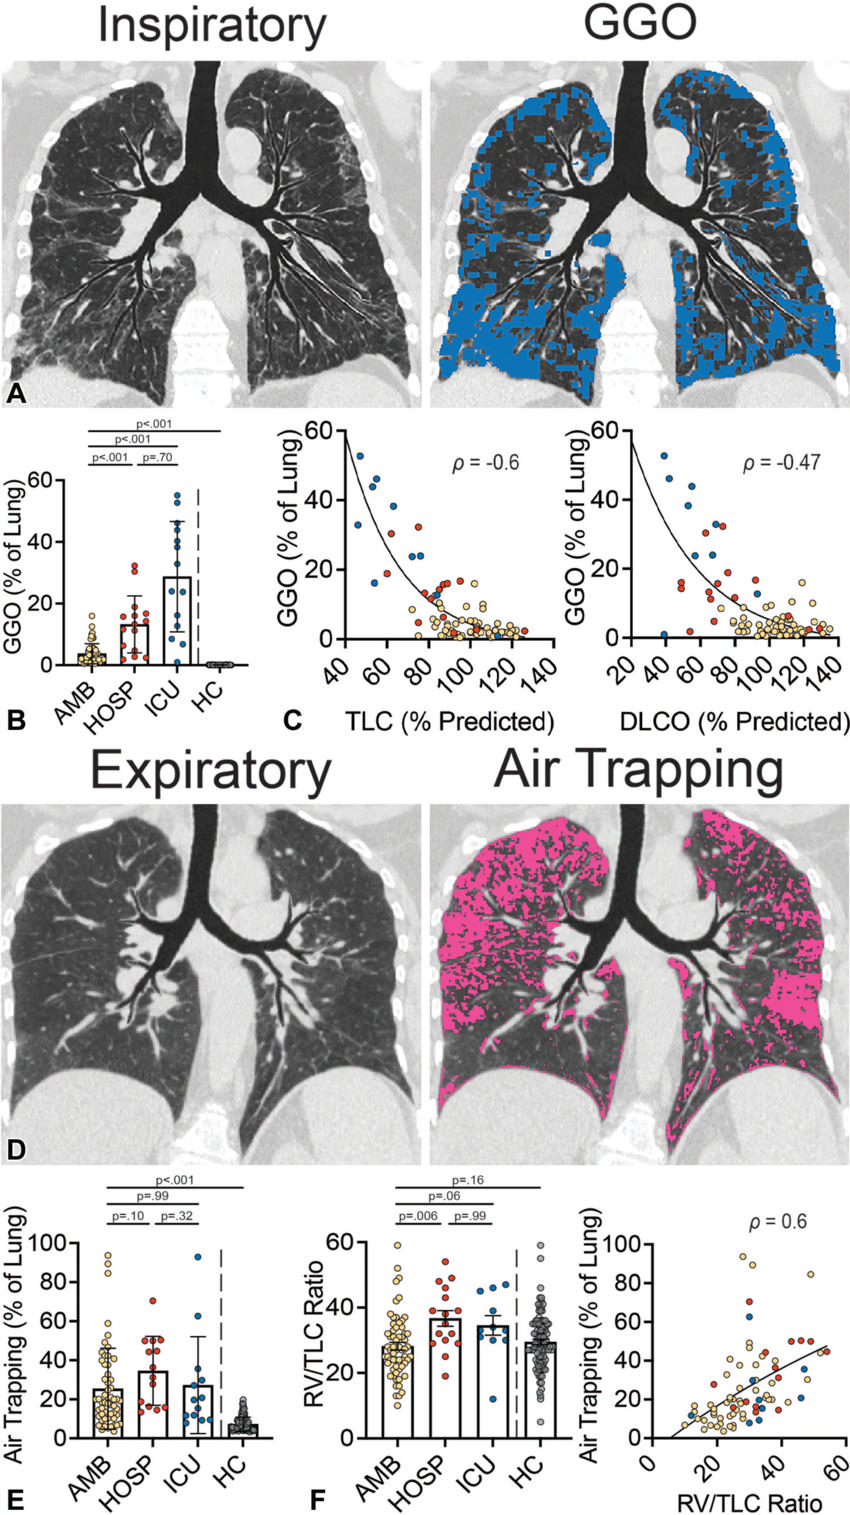
Figure 3. Quantitative chest CT and correlation with pulmonary function. (A) Chest CT (left) from a 60-year-old male participant with PASC (hospitalized group). Representative coronal image from an inspiratory non-contrast chest CT obtained at total lung capacity (TLC). The corresponding texture analysis map (right) highlights ground glass opacities (GGO; in blue). (B) Quantification of GGO measured via texture analysis. (C) Correlation of GGO with percent predicted TLC (left) and diffusing capacity of the lung for carbon monoxide (DLCO) (right). (D) Chest CT (left) obtained from a 61-year-old female participant with PASC (ambulatory group). Representative coronal image from an expiratory non-contrast chest CT obtained at residual volume (RV). The corresponding disease probability measure (DPM) map (right) highlights air trapping (in pink). (E) Quantification of air trapping measured via DPM. (F) Ratio of RV to TLC measured via plethysmography and correlation of air trapping with RV/TLC. Images (A and D) were prepared using topographic multi-planar reformat (tMPR) rendering, which serves to display the airways and associated parenchyma on the same plane. Data are displayed as mean and SEM (B, E, and F). Yellow circles, ambulatory; red circles, hospitalized; blue circles, ICU. Abbreviations: AMB, ambulatory; HOSP, hospitalized; ICU, intensive care unit; HC, healthy controls. P values calculated using Dunn’s test for post-hoc comparisons between groups (B, E, and F). Spearman’s correlation was used to calculate r values (C and F).
High-res (TIF) version
(Right-click and Save As)