Study Analyzes a Decade of Cardiac Imaging Trends
Released: September 30, 2021
At A Glance
- Rate of cCTA by radiologists in hospital outpatient departments increased by 355%.
- Researchers studied data from the 2010-2019 Physician Supplier Procedure Summary files.
- The increased rate of cCTAs performed by radiologists represents a growing opportunity for collaboration in cardiac imaging.
- RSNA Media Relations
1-630-590-7762
media@rsna.org - Linda Brooks
1-630-590-7738
lbrooks@rsna.org - Katherine Anderson
1-630-491-1009
kanderson@rsna.org
OAK BROOK, Ill. — A new study published in Radiology: Cardiothoracic Imaging on cardiac imaging trends over a decade reports that the rate of coronary computed tomography angiography (cCTA) exams by radiologists in hospital outpatient departments increased markedly from 2010 to 2019, suggesting a bright future for the technology. The study also found that reimbursement cuts and advances in technology have helped shift much of the imaging done by cardiologists from the office to hospital outpatient department.
Imaging has long played a critical role in the diagnosis of cardiovascular disease, the leading killer in the world. Both radiologists and cardiologists perform noninvasive cardiac imaging, but over time two of the most common cardiac imaging methods, echocardiography and myocardial perfusion imaging, became almost exclusively the domain of cardiologists.
The dominance was partly due to a cardiologist’s unique position as a provider who both orders and performs diagnostic cardiac imaging. However, reimbursement cuts from the Deficit Reduction Act (DRA) of 2005 had a major impact on in-office cardiac imaging.
“In the early 2000s, cardiology office imaging utilization was skyrocketing,” said study lead author Russell A. Reeves, M.D., from the Center for Research on Utilization of Imaging Service (CRUISE) and diagnostic radiology resident in the Department of Radiology at Thomas Jefferson University in Philadelphia. “The changes brought by DRA reversed that trend to where it no longer was lucrative or even feasible for a lot of cardiologists to do imaging in their offices.”
During that same period, technological advances made competing imaging exams traditionally performed by radiologists, such as cCTA, appealing options.
Dr. Reeves and colleagues studied data from the 2010-2019 Physician Supplier Procedure Summary files to assess the impact of these developments on utilization of different types of cardiac imaging.
They found that cardiologist in-office myocardial perfusion imaging rates per 100,000 Medicare beneficiaries dropped by 52%, from 4,426 to 2,119, over the 10-year period. Correspondingly, imaging rates per 100,000 beneficiaries at hospital outpatient departments rose 71%, from 935 to 1,598.
“Cardiologists are not performing nearly as many myocardial perfusion scans as they were, and most are now being done at hospital outpatient imaging departments,” Dr. Reeves said.
Over the same period, the rates of cCTA by radiologists in hospital outpatient departments increased by 355%. Overall rates, however, remained low compared to myocardial perfusion imaging, despite the fact that some studies have shown cCTA to be more accurate. The technology’s uptake may be limited, Dr. Reeves said, by its complexity and the cost of equipment, in addition to the fact that it requires a dedicated technologist.
Still, he said, the increasing rate of cCTAs performed by radiologists represents a growing opportunity for collaboration in cardiac imaging. Recently at Thomas Jefferson, cardiologists have shown interest in reading cCTA exams side-by-side with radiologists to enhance patient care.
“Coronary CTA is a useful screening tool for coronary artery disease that obviates the need for invasive coronary angiography,” Dr. Reeves said. “I think the future is looking favorably on it.”
Rates of cardiac PET (cPET) in cardiologist offices increased by 193% over the 10-year period, but cardiac PET performed by radiologists in offices and hospital outpatient departments saw little change. The increase in in-office cPET is likely due to a combination of technological advances, interpretation familiarity and financial incentives, according to Dr. Reeves.
Dr. Reeves plans to continue following the trends to study the impact of regulatory, economic and other factors on imaging utilization.
“Ultimately, we as radiologists need to be self-regulators and also do the research to support change, to help the specialty and help medical practices overall in the future,” he said.
The research is also a way of honoring the legacy of Dr. Reeves’ mentor, David Levin, M.D., professor and chairman emeritus at Thomas Jefferson University. Dr. Levin, a former fighter pilot who became a leading researcher in imaging utilization trends and founded CRUISE, died in 2020.
“Cardiac Imaging Trends from 2010 to 2019 in the Medicare Population.” Collaborating with Dr. Reeves were Ethan J. Halpern, M.D., and Vijay M. Rao, M.D., FACR.
Radiology: Cardiothoracic Imaging is edited by Suhny Abbara, M.D., University of Texas Southwestern Medical Center, Dallas, and owned and published by the Radiological Society of North America, Inc. (https://pubs.rsna.org/cardiothoracic-imaging)
RSNA is an association of radiologists, radiation oncologists, medical physicists and related scientists promoting excellence in patient care and health care delivery through education, research and technologic innovation. The Society is based in Oak Brook, Illinois. (RSNA.org)
For more information about cCTA, visit RadiologyInfo.org.
Images (JPG, TIF):

Figure 1. Transthoracic echocardiography (TTE) rates per 100,000 Medicare beneficiaries by specialty and place of service. Card = cardiologist, ED = emergency department, HOPD = hospital outpatient department, Rad = radiologist.
High-res (TIF) version
(Right-click and Save As)

Figure 2. Stress echocardiography (SE) rates per 100,000 Medicare beneficiaries by specialty and place of service. Card = cardiologist, ED = emergency department, HOPD = hospital outpatient department, Rad = radiologist.
High-res (TIF) version
(Right-click and Save As)

Figure 3. Coronary CTA (cCTA) rates per 100,000 Medicare beneficiaries by specialty and place of service. Card = cardiologist, ED = emergency department, HOPD = hospital outpatient department, Rad = radiologist.
High-res (TIF) version
(Right-click and Save As)

Figure 4. Cardiac MRI (cMRI) rates per 100,000 Medicare beneficiaries by specialty and place of service. Card = cardiologist, ED = emergency department, HOPD = hospital outpatient department, Rad = radiologist.
High-res (TIF) version
(Right-click and Save As)

Figure 5. Myocardial perfusion imaging (MPI) rates per 100,000 Medicare beneficiaries by specialty and place of service. Card = cardiologist, ED = emergency department, HOPD = hospital outpatient department, Rad = radiologist.
High-res (TIF) version
(Right-click and Save As)

Figure 6. Cardiac PET (cPET) rates per 100,000 Medicare beneficiaries by specialty and place of service. Card = cardiologist, HOPD = hospital outpatient department, Rad = radiologist.
High-res (TIF) version
(Right-click and Save As)

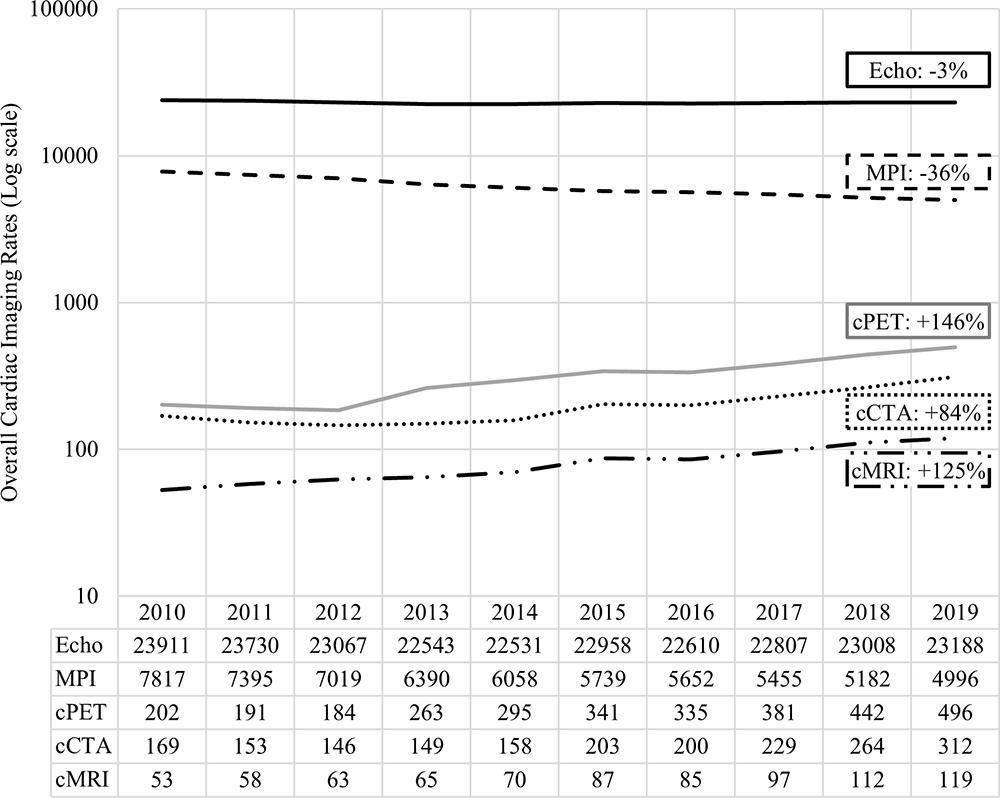
Figure 7. Overall cardiac imaging rates per 100,000 Medicare beneficiaries by noninvasive imaging modality. A log10 scale was used for rates to separate the differences between the cPET, cCTA, and cMRI trendlines. TTE, TEE, and SE were combined (Echo) given the small numbers of TEE and SE. The 2010 to 2019 percentage changes per modality are listed. SE = stress echocardiography, TEE = transesophageal echocardiography, TTE = transthoracic echocardiography.
High-res (TIF) version
(Right-click and Save As)
