Researchers Use Deep Learning to Predict Breast Cancer Risk
Released: September 07, 2021
At A Glance
- Researchers trained a deep learning model to find details in mammograms that might be linked to increased cancer risk.
- The model outperformed clinical risk factors—including breast density—in determining screening-detected cancer risk.
- The findings support a role for AI in combination with clinical risk factors in breast cancer risk assessment.
- RSNA Media Relations
1-630-590-7762
media@rsna.org - Linda Brooks
1-630-590-7738
lbrooks@rsna.org - Katherine Anderson
1-630-491-1009
kanderson@rsna.org
OAK BROOK, Ill. — Compared with commonly used clinical risk factors, a sophisticated type of artificial intelligence (AI) called deep learning does a better job distinguishing between the mammograms of women who will later develop breast cancer and those who will not, according to a new study in the journal Radiology. Researchers said the findings underscore AI’s potential as a second reader for radiologists that can reduce unnecessary imaging and associated costs.

Annual mammography is recommended for women starting at age 40 to screen for breast cancer. Research has shown that screening mammography lowers breast cancer mortality by reducing the incidence of advanced cancer.
Mammograms not only help detect cancer but also provide a measure of breast cancer risk through measurements of breast density. While denser breasts on mammography are associated with a higher risk of cancer, there are other, yet unknown, factors hidden in the mammogram that likely contribute to risk.
“Conventional methods of breast cancer risk assessment using clinical risk factors haven’t been that effective,” said study lead author John A. Shepherd, Ph.D., professor and researcher in the Population Sciences in the Pacific Program (Epidemiology) at the University of Hawaii Cancer Center in Honolulu. “We thought that there was more in the image than just breast density that would be useful for assessing risk.”
For the new study, Dr. Shepherd and colleagues used a data set of more than 25,000 digital screening mammograms from 6,369 women who participated in screening mammography. More than 1,600 of the women developed screening-detected breast cancer, and 351 developed interval invasive breast cancer.
The researchers trained the deep learning model to find details, or signals, in the mammogram that might be linked to increased cancer risk. When they tested the deep learning-based model, it underperformed in assessing the risk factors for interval cancer risk, but it outperformed clinical risk factors including breast density in determining screening-detected cancer risk.
“The results showed that the extra signal we’re getting with AI provides a better risk estimate for screening-detected cancer,” Dr. Shepherd said. “It helped us accomplish our goal of classifying women into low risk or high risk of screening-detected breast cancer.”
The findings have significant implications for clinical practices in which breast density alone guides many management decisions. Instead of being advised to return next year for another screening, women with a negative mammogram could be sorted by risk into one of three pathways: low risk of breast cancer, elevated screening-detected risk, or elevated interval invasive cancer in the next three years, the average follow-up time for the study.
“This would allow us to use a woman’s individual risk to determine how frequently she should be monitored,” Dr. Shepherd said. “Lower-risk women might not need to be monitored with mammography as often as those with a high risk of breast cancer.”
The deep learning model also has promise in supporting decisions about additional imaging with MRI and other modalities. Dr. Shepherd said that women in the high-risk deep learning group who also have dense breasts and are at a higher risk for interval cancers may benefit most from a monitoring strategy that includes supplemental imaging that retains sensitivity in dense breasts such as MRI, ultrasound and molecular imaging. Interval cancers usually have more aggressive tumor biology and are typically discovered at an advanced stage.
Along with other recent research, the new study supports a role for AI in combination with clinical risk factors in breast cancer risk assessment.
“By ranking mammograms in terms of the probability of seeing cancer in the image, AI is going to be a powerful second reading tool to help categorize mammograms,” Dr. Shepherd said.
The researchers are planning to replicate the study in Native Hawaiian and Pacific Islander women, two groups that have been underrepresented in breast cancer research. They also want to extend the work beyond cancer risk to look at the risk of different grades of breast cancer, from least to most aggressive.
“Deep Learning Predicts Interval and Screening-detected Cancer from Screening Mammograms: A Case-Case-Control Study in 6369 Women.” Collaborating with Dr. Shepherd were Xun Zhu, Ph.D., Thomas K. Wolfgruber, Ph.D., Lambert Leong, M.S., Matthew Jensen, B.S., Christopher Scott, M.S., Stacey Winham, Ph.D., Peter Sadowski, Ph.D., Celine Vachon, Ph.D., and Karla Kerlikowske, M.D.
Radiology is edited by David A. Bluemke, M.D., Ph.D., University of Wisconsin School of Medicine and Public Health, Madison, Wisconsin, and owned and published by the Radiological Society of North America, Inc. (https://pubs.rsna.org/journal/radiology)
RSNA is an association of radiologists, radiation oncologists, medical physicists and related scientists promoting excellence in patient care and health care delivery through education, research and technologic innovation. The Society is based in Oak Brook, Illinois. (RSNA.org)
For patient-friendly information on breast cancer screening, visit RadiologyInfo.org.
Images (JPG, TIF):
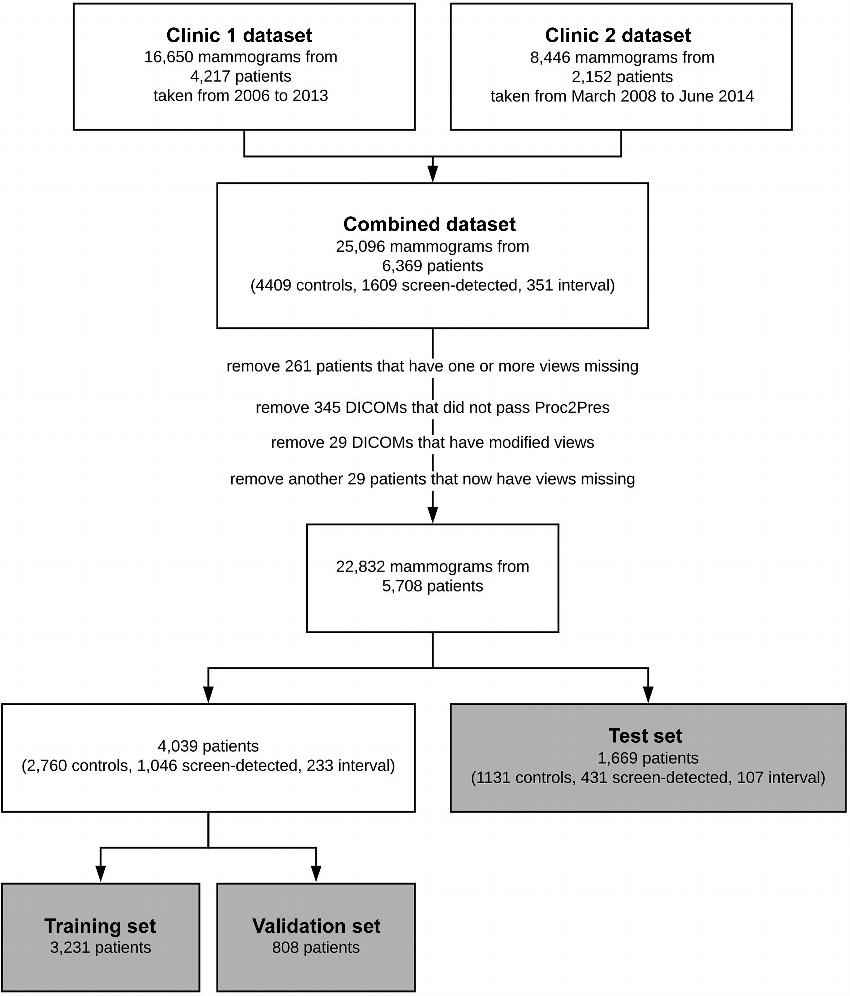
Figure 1. Flowchart shows structure of our data. Data came from two sources—clinic 1 and clinic 2. The clinics split the data into a training set (“train”), a testing set (validation set), and an external testing set (test set). During training, the “train” set is split into a training set and a validation set with a size ratio of 4:1. Images with technical irregularities (eg, those in which one or more views were missing or those that did not pass the preprocessing steps [Proc2Pres]) were removed before training. DICOM = Digital Imaging and Communications in Medicine.
High-res (TIF) version
(Right-click and Save As)
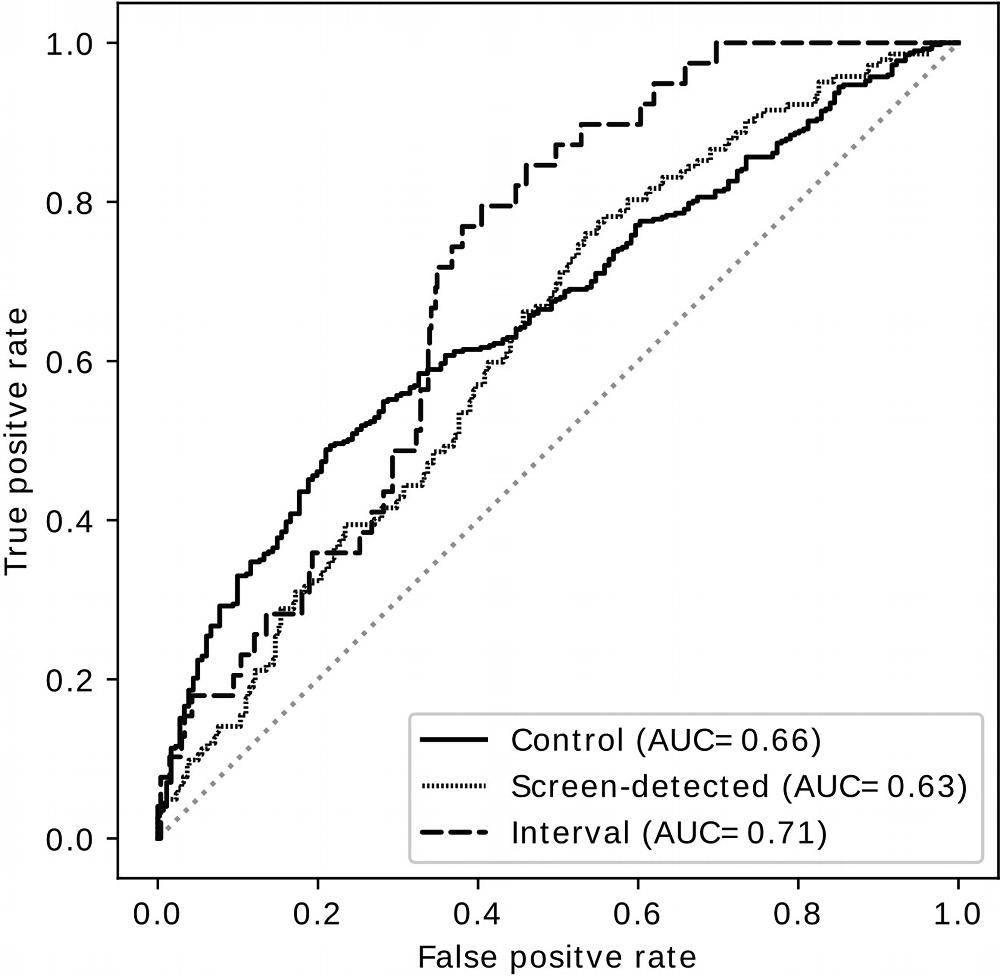
Figure 2. Receiver operating characteristic curves show performance of the deep learning predictor as a yes-no decision between any group and the rest of the two groups. AUC = area under the receiver operating characteristic curve.
High-res (TIF) version
(Right-click and Save As)