Lung Cancer Screening Predicts Risk of Death from Heart Disease
Released: April 15, 2021
At A Glance
- A deep learning algorithm accurately predicts the risk of death from cardiovascular disease using information from lung cancer screening CT exams.
- Data from 4,451 participants in the National Lung Screening Trial was used to train the algorithm to quantify six types of vascular calcification.
- Cardiovascular disease is the leading cause of mortality worldwide. It outpaces lung cancer as the leading cause of death in heavy smokers.
- RSNA Media Relations
1-630-590-7762
media@rsna.org - Linda Brooks
1-630-590-7738
lbrooks@rsna.org - Katherine Anderson
1-630-491-1009
kanderson@rsna.org
OAK BROOK, Ill. — A deep learning algorithm accurately predicts the risk of death from cardiovascular disease using information from low-dose CT exams performed for lung cancer screening, according to a study published in Radiology: Cardiothoracic Imaging.
Cardiovascular disease is the leading cause of mortality worldwide. It even outpaces lung cancer as the leading cause of death in heavy smokers.
Low-dose CT lung scans are used to screen for lung cancer in high-risk people such as heavy smokers. These CT scans also provide an opportunity to screen for cardiovascular disease by extracting information about calcification in the heart and aorta. The presence of calcium in these areas is linked with the buildup of plaque and is a strong predictor for cardiovascular disease mortality, heart attacks and strokes.
Previous studies have used information extracted from CT images as well as other risk factors, such as cholesterol levels and blood pressure, and self-reported clinical data, such as history of illness.

For the new study, researchers tested a faster, automated method that can predict five-year cardiovascular disease mortality with only minimal extra workload. The method draws upon the power of deep learning, an advanced type of artificial intelligence in which the computer algorithm essentially learns from the images the important features for mortality prediction.
Using data from 4,451 participants, median age 61 years, who underwent low-dose CT over a two-year period in the National Lung Screening Trial, the researchers trained the method to quantify six types of vascular calcification. They then tested the method on data from 1,113 participants.
The prediction model using calcium scores outperformed the baseline model that used only self-reported participant characteristics, such as age, history of smoking, and history of illness.
The method works in two stages, according to study lead author Bob D. de Vos, Ph.D., from Amsterdam University Medical Center in Amsterdam and the Image Sciences Institute, University Medical Center Utrecht, in Utrecht, the Netherlands. The first stage determines the amount and location of arterial calcification in the coronary arteries and the aorta using deep learning. The second stage uses a more conventional statistical approach for mortality prediction. The second stage also indicates which features are most predictive for five-year mortality.
"The analysis shows we found predictors that are typically not described in a literature, possibly because we performed analysis in lung cancer screening participants who are already at high risk of cardiovascular disease from a history of heavy smoking and the presence of extensive arterial calcification," Dr. de Vos said.
The method could easily be integrated into lung cancer screening, Dr. de Vos said. It does not require any special equipment and would not add time to the exam.
"The method uses only image information, it is fully automatic, and it is fast," Dr. de Vos said. "The method obtains calcium scores in a complete chest CT in less than half a second. This means that the method should be easy to implement in routine patient work ups and screening."
Most importantly, the method could help identify people in a population of heavy smokers who might be at increased risk of death from cardiovascular disease-related causes.
"Lung screening studies show that heavy smokers die from cardiovascular disease as much as from lung cancer," Dr. de Vos said. "But we also see that some people with very high calcium scores survive, while others with low scores do suffer from major cardiac events. The work offers a direction for future research to precisely pinpoint which calcifications are dangerous."
The researchers have developed a number of methods for automatic calcium scoring that can be applied to a wide variety of data. They are now working toward a calcium scoring method that accurately detects arterial calcification in low-quality data, like data affected by cardiac motion, low image resolution or high noise levels.
"We developed a method, for example, that can detect coronary calcifications even when the lesions are below the clinically used threshold," Dr. de Vos said. "This way, we hope to increase the reproducibility of calcium scoring and enable more accurate prediction."
The United States Preventive Services Task Force (USPSTF) recently expanded its recommendation for low-dose CT lung cancer screening to include high-risk individuals, 50 to 80 years of age, who have a 20-pack-year or more history of smoking and are either current smokers or former smokers who have quit within the last 15 years, facilitating screening access for a larger and more diverse population. Read more in RSNA News.
"Deep Learning-Quantified Calcium Scores for Automatic Cardiovascular Mortality Prediction at Lung Screening Low-Dose CT." Collaborating with Dr. de Vos were Nikolas Lessmann, Ph.D., Pim A. de Jong, M.D., Ph.D., and Ivana Išgum, Ph.D.
Radiology: Cardiothoracic Imaging is edited by Suhny Abbara, M.D., University of Texas Southwestern Medical Center, Dallas, and owned and published by the Radiological Society of North America, Inc. (https://pubs.rsna.org/cardiothoracic-imaging)
RSNA is an association of radiologists, radiation oncologists, medical physicists and related scientists promoting excellence in patient care and health care delivery through education, research and technologic innovation. The Society is based in Oak Brook, Ill. (RSNA.org)
For patient-friendly information on lung cancer screening, visit RadiologyInfo.org.
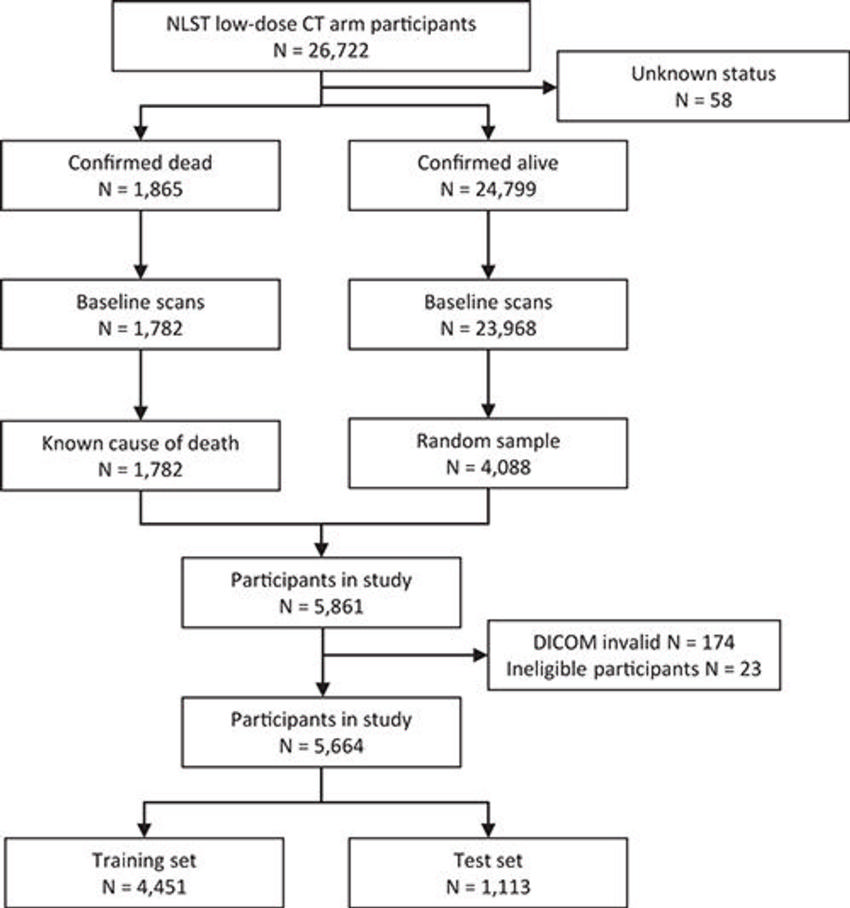
Figure 1. Flowchart illustrates the selection of the studied cohort of National Lung Screening Trial (NLST) participants.
High-res (TIF) version
(Right-click and Save As)

Figure 2. Projections of all aligned chest CT scans show feasibility of slab-based quantification of calcium, resulting in an average image. For alignment, only translation, rotation, and scaling were allowed, resulting in a blurry image, because not all anatomy is exactly the same across participants. From left to right, the center axial, sagittal, and coronal sections are shown. Note that field of view is similar to cardiac CT, which is a consequence of image alignment by the used automatic calcium scoring method. Image alignment allowed the determination of calcification distributions into slabs as a proxy measure for proximal and distal calcifications, of which the borders are indicated by the horizontal lines.
High-res (TIF) version
(Right-click and Save As)
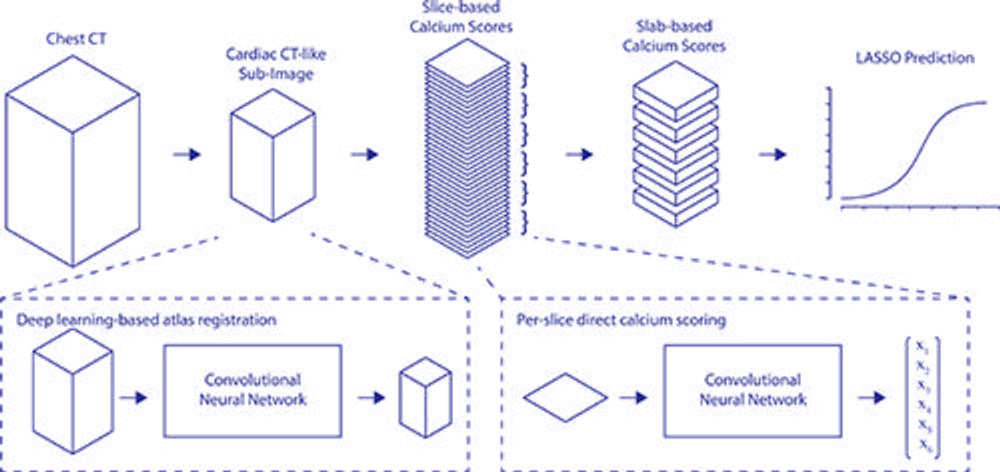
Figure 3. Full pipeline from input to output. xn = resulting calcium scores. LASSO = least absolute shrinkage and selection operator.
High-res (TIF) version
(Right-click and Save As)
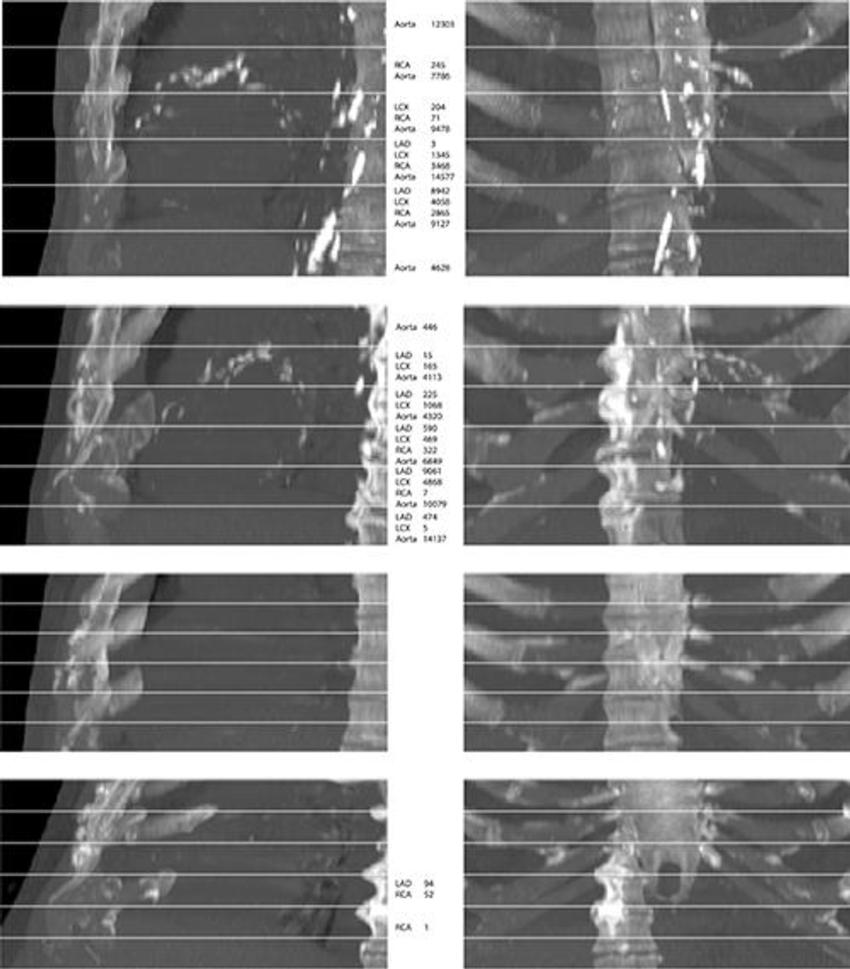
Figure 4. From top to bottom, maximum intensity projections of four randomly selected images from the evaluation set. The top two rows show cases that contain extensive arterial calcification (mainly the aortic arch), and the bottom two rows show controls containing none or limited arterial calcification. The left and right columns show maximum intensity projections of respective sagittal views and coronal views. The middle column lists Agatston scores if present in the slab. Note that none of the examples contained valve calcifications. Images have been automatically aligned such that they mimic the field of view of cardiac CT. However, for visualization purposes, large parts of the ribs and the vertebrae have been manually cropped from these examples. LAD = left anterior descending artery, LCX = left circumflex artery, RCA = right coronary artery.
High-res (TIF) version
(Right-click and Save As)
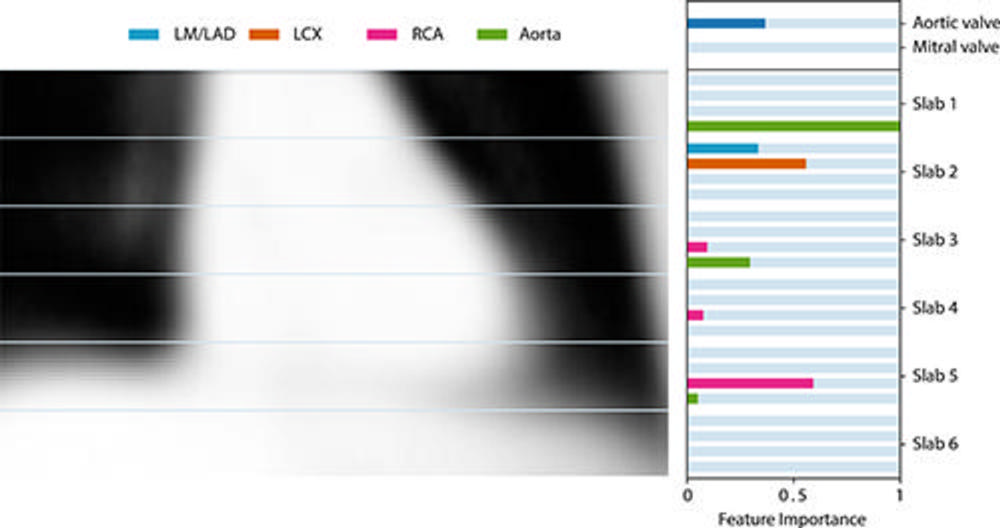
Figure 5. Feature importance of the derived model using only location-specific calcium scores as image features. Feature importance is determined by scaling the coefficients obtained by least absolute shrinkage and selection operator regression. For reference, the average coronal center section of all aligned chest CT scans is shown. LAD = left anterior descending artery, LCX = left circumflex artery, LM = left main, RCA = right coronary artery.
High-res (TIF) version
(Right-click and Save As)
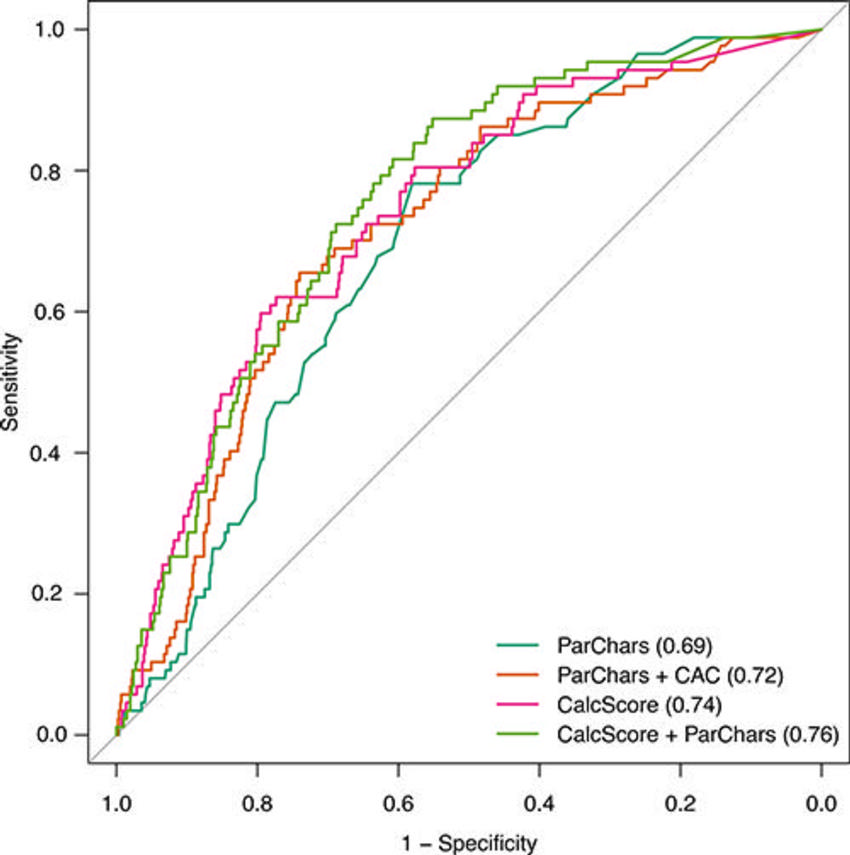
Figure 6. Receiver operating characteristic (ROC) curves for derived models predicting 5-year cardiovascular disease mortality. ROC curves were obtained from the test cohort. Models were derived using participant characteristics (ParChars), a combination of participant characteristics and total coronary calcium scores (ParChars+CAC), our proposed location-specific calcium scores (CalcScore), and finally by a combination of participant characteristics data and location-specific calcium scores (ParChars+CalcScore). Please note that 95% confidence regions of all ROC curves overlap heavily and are thus not shown.
High-res (TIF) version
(Right-click and Save As)