3D Fusion Imaging Improves Coronary Artery Disease Diagnosis
Released: April 16, 2020
At A Glance
- Combining CT and CMR into a 3D image improves coronary artery disease diagnosis.
- The technique may better identify patients in need of revascularization.
- Coronary artery disease is the most common type of heart disease, affecting about 18.2 million adults in the U.S.
- RSNA Media Relations
1-630-590-7762
media@rsna.org - Linda Brooks
1-630-590-7738
lbrooks@rsna.org - Dionna Arnold
1-630-590-7791
darnold@rsna.org
OAK BROOK, Ill. — A new technique that combines CT and MRI can bolster coronary artery disease diagnosis and help to define appropriate treatment for patients suffering from the disease, according to a new study published in the journal Radiology: Cardiothoracic Imaging.

Coronary artery disease is the most common type of heart disease, according to the Centers for Disease Control and Prevention. About 18.2 million adults in the United States have coronary artery disease.
CT and MRI are established methods for noninvasive cardiac imaging and evaluation of coronary artery disease. CT is particularly useful for high-resolution images of the coronary anatomy, while cardiac MRI can provide information on blood supply to the heart muscle without exposing patients to ionizing radiation.
Despite their complementary strengths, CT and MRI findings are often analyzed separately, limiting the ability to fully leverage the strengths of the two methods.
“From this experience, the idea came up to fuse information on different pathologic aspects of the disease and to combine them in a single 3D image, which can be interpreted in a very quick but highly accurate fashion,” said study lead author, Jochen von Spiczak, M.D., M.Sc., radiologist and computer scientist at Institute of Diagnostic and Interventional Radiology, University Hospital Zurich in Zurich, Switzerland.
Existing methods of combining CT and MRI have limitations, as they look at only a limited subset of the many aspects of coronary artery disease. Dr. von Spiczak and colleagues overcame these limitations by developing an approach that depicts all the available information from CT and cardiac MRI in one 3D image.
They compared their approach with conventional 2D readouts in 17 patients who underwent cardiac CT and cardiac MRI due to suspected or known coronary artery disease.
Conventional 2D readout of the images resulted in uncertain findings in eight cases. The new approach helped solve the divergent findings in six of those cases.
Information from the 3D fused image helped correlate specific stenoses, or areas of narrowing in the coronary arteries, and their severity with possible cardiac scar tissue and ischemia—a condition in which parts of the heart muscle don’t get enough blood. This could be used to help guide interventional or surgical revascularization procedures like stenting or bypass surgery that improve blood supply to the heart.
“The technique may allow for an easier and possibly more accurate identification of patients and coronary stenoses that are likely to benefit from revascularization,” Dr. von Spiczak said. “Applying today’s clinical 2D standard led to a substantial number of uncertain findings in our study, whereas most of these divergent findings could be solved when including additional information from CT-derived blood flow estimates information and 3D image fusion.”
The study points to a role for the fused approach in complex cases that yield uncertain findings in the first test, such as when results from CT and MRI are inconsistent or even contradictory.
Obstacles to its implementation include higher costs and complexity, problems that may be eased by advances in software, according to Dr. von Spiczak.
“Multimodal Multiparametric Three-dimensional Image Fusion in Coronary Artery Disease: Combining the Best of Two Worlds.” Collaborating with Dr. von Spiczak were Manoj Mannil, M.D., M.Sc., Hanna Model, M.D., Chris Schwemmer, Ph.D., Sebastian Kozerke, Ph.D., Frank Ruschitzka, M.D., Hatem Alkadhi, M.D., M.P.H., and Robert Manka, M.D.
Radiology: Cardiothoracic Imaging is edited by Suhny Abbara, M.D., University of Texas Southwestern Medical Center, Dallas, and owned and published by the Radiological Society of North America, Inc. (https://pubs.rsna.org/cardiothoracic-imaging)
RSNA is an association of radiologists, radiation oncologists, medical physicists and related scientists promoting excellence in patient care and health care delivery through education, research and technologic innovation. The Society is based in Oak Brook, Ill. (RSNA.org)
For patient-friendly information on cardiac CT and MRI, visit RadiologyInfo.org.
Press Resources:
Images (JPG, TIF):
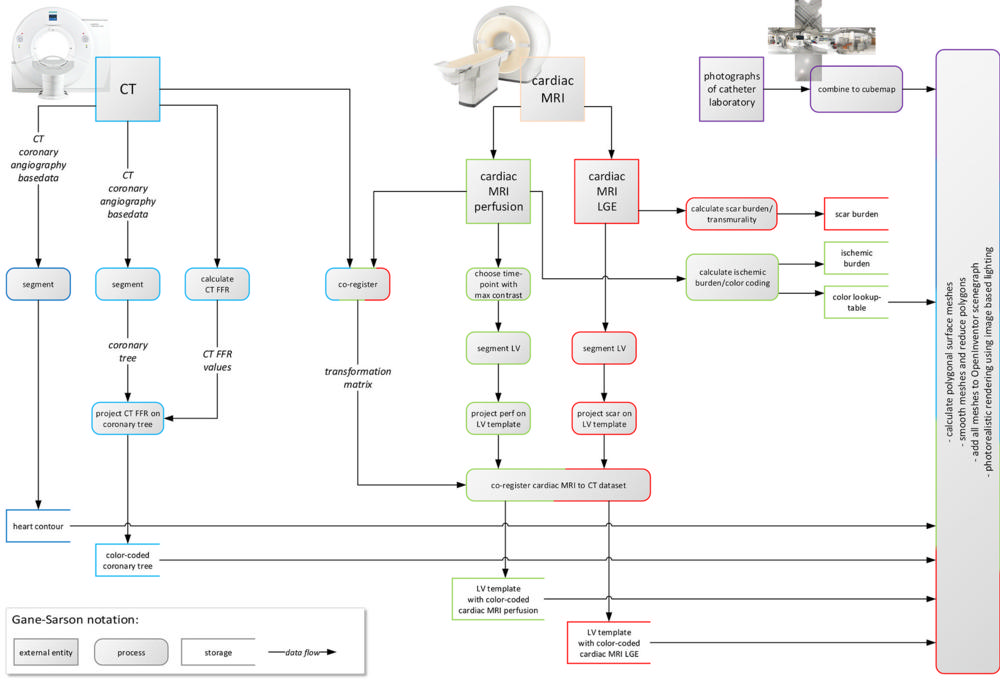
Figure 1. Data flow diagram illustrates CT and cardiac MRI postprocessing. From CT, segmented heart contour and color-coded coronary tree were derived. From cardiac MRI, cardiac MRI perfusion and cardiac MRI late gadolinium enhancement (LGE) images were derived, segmented, projected onto high-resolution templates of left ventricle (LV), co-registered, and color-coded. Finally, all four resulting volume data sets were rendered in common three-dimensional scene. CT FFR = CT-derived fractional flow reserve.
High-res (TIF) version
(Right-click and Save As)
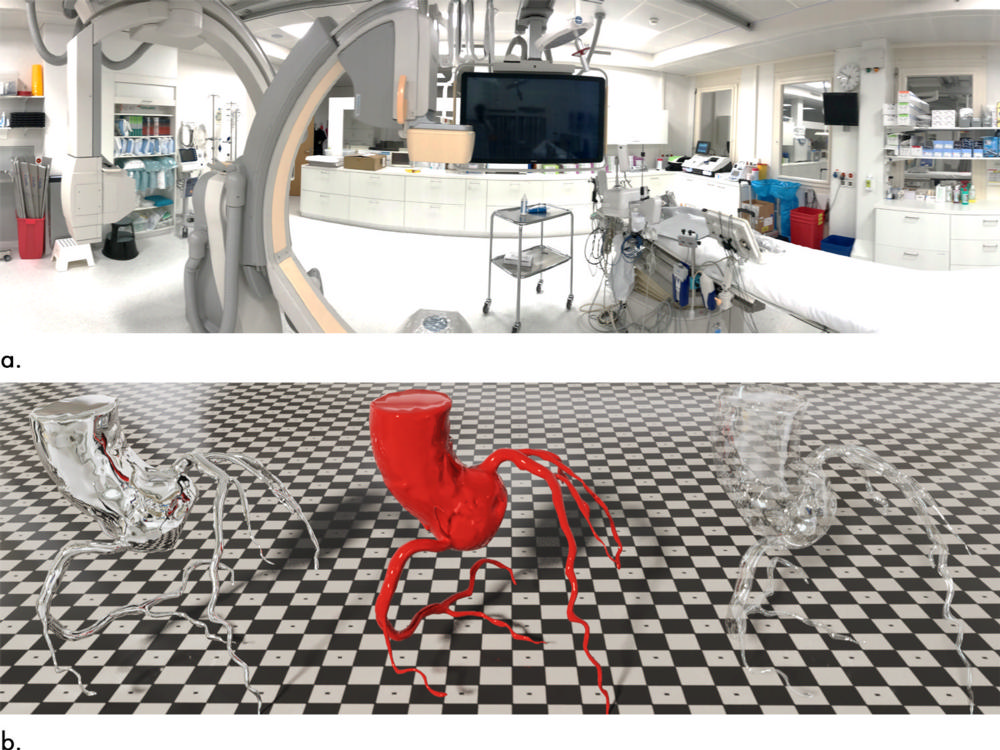
Figure 2. Images demonstrate image-based lighting and Disney’s “principled” reflectance model. (a) Multiple photographs of Andreas Grüntzig catheter laboratory were taken (exemplarily, one panoramic shot is shown). Pictures were assembled to a cube map, which projected entire 720° environment onto six faces of a cube and served as the basis for highly detailed real-world lighting in context of cardiac interventional suite. (b) To demonstrate effect, data from one nonpathologic CT coronary angiography were rendered three times with different surface qualities defined by the “principled” reflectance model. Fully reflective surface mirrors surroundings of catheter laboratory (left); glassy appearance is both reflective and translucent (right); polished red surface texture demonstrates interplay of all rendering aspects (center).
High-res (TIF) version
(Right-click and Save As)
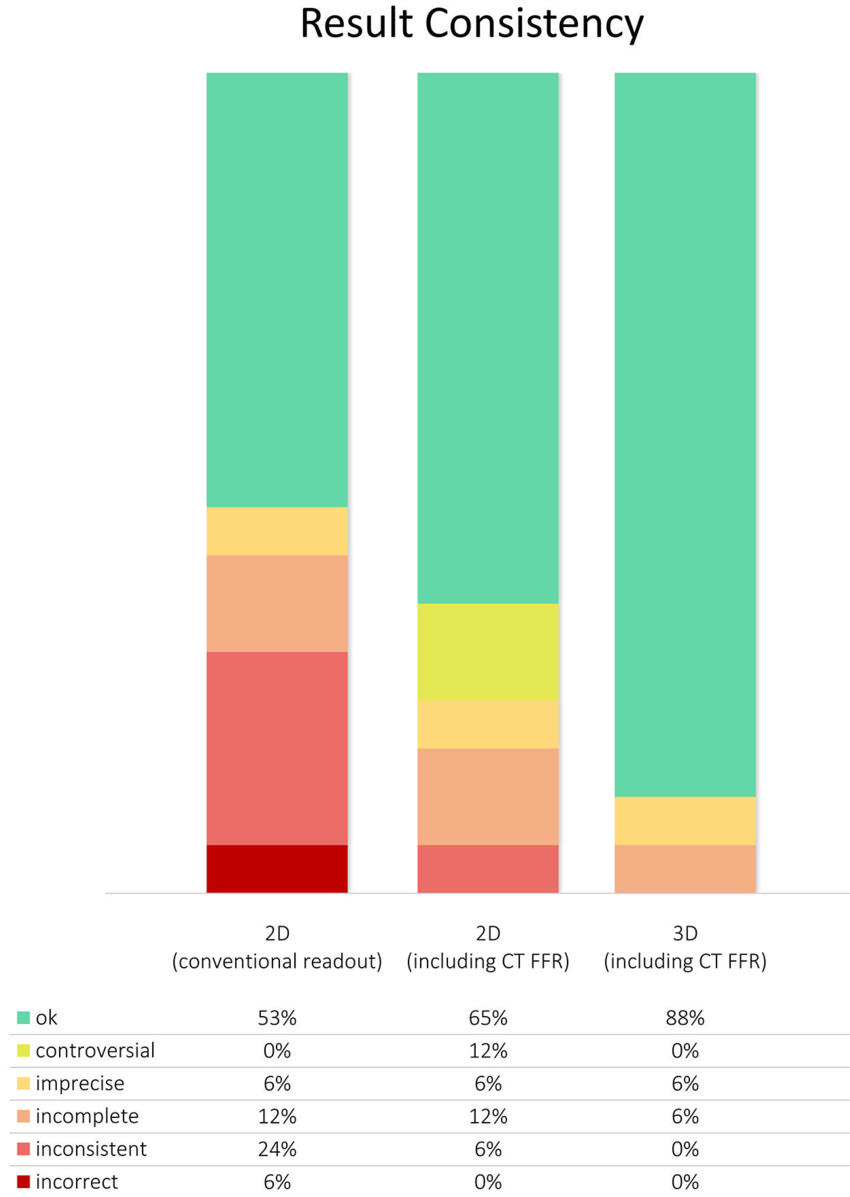
Figure 3. Graph shows consistency of results from conventional two-dimensional (2D) readout, 2D readout including CT-derived fractional flow reserve (CT FFR), and three-dimensional (3D) image fusion. As is usually done in daily clinical routine, multiple imaging modalities were separately analyzed in conventional 2D readout. Areas of hypoperfusion and/or myocardial scar were attributed to one of the main coronary arteries based on their standard supply territories. Using this approach, we found controversial, imprecise, incomplete, inconsistent, and/or incorrect results in 47% of cases. Most of these divergent findings could be solved when adding information from CT FFR and 3D image fusion.
High-res (TIF) version
(Right-click and Save As)
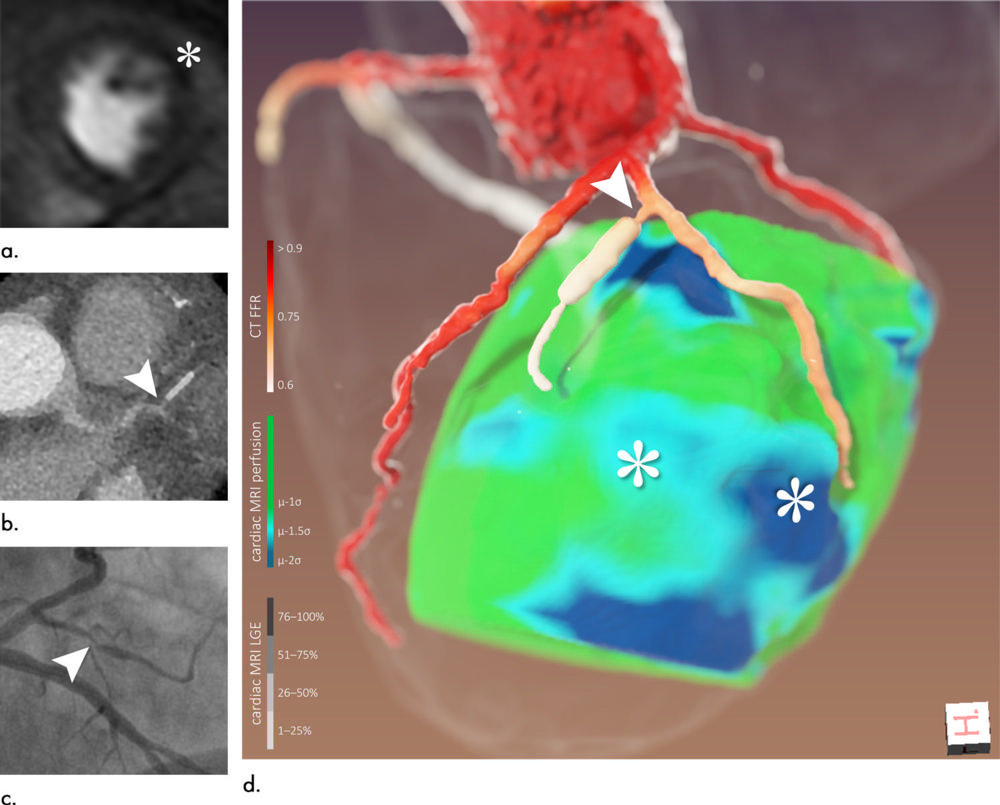
Figure 4. Images of a 65-year-old man (patient 6). (a) Cardiac MRI perfusion shows perfusion deficit of anterior/anterolateral wall attributed to left anterior descending artery/left circumflex artery (*). (b) CT coronary angiography. (c) Coronary angiography, left anterior oblique projection with caudal angulation. (d) Three-dimensional image fusion helped refine diagnosis: perfusion deficits (*) were most likely caused by narrow first diagonal branch and its first, stented side branch (arrowhead). Retrospectively, denoted lesion could also be found at CT coronary angiography and coronary angiography (arrowheads in b and c, respectively). CT FFR = CT-derived fractional flow reserve, LGE = late gadolinium enhancement.
High-res (TIF) version
(Right-click and Save As)
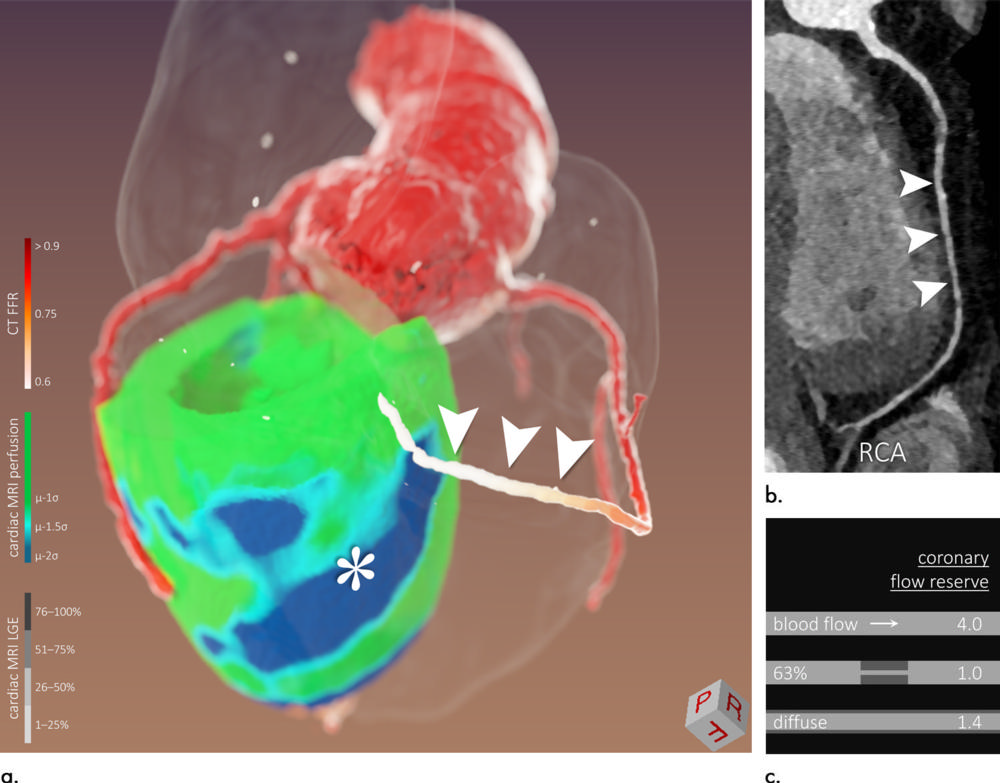
Figure 5. Images of a 58-year-old man (patient 7). Three-dimensional (3D) image fusion (a) alongside CT coronary angiography (b: curved multiplanar reformation of right coronary artery [RCA]). Conventional two-dimensional readout without CT-derived fractional flow reserve (CT FFR) was inconsistent: In cardiac MRI perfusion, inferior/inferoseptal hypoperfusion was found without significant lesion of RCA in CT coronary angiography or coronary angiography. In this case, CT FFR in combination with 3D image fusion helped: inferior/inferoseptal perfusion deficit (* in a) was most likely caused by diffuse concentric narrowing of RCA (a and b, arrowheads) with pathologic CT FFR. This patient underwent a heart transplant, and diffuse vessel narrowing might have been caused by cardiac allograft vasculopathy. As illustrated in (c), diffuse lumen narrowing can lead to flow restrictions similar to those of focal stenosis of higher degree. LGE = late gadolinium enhancement.
High-res (TIF) version
(Right-click and Save As)
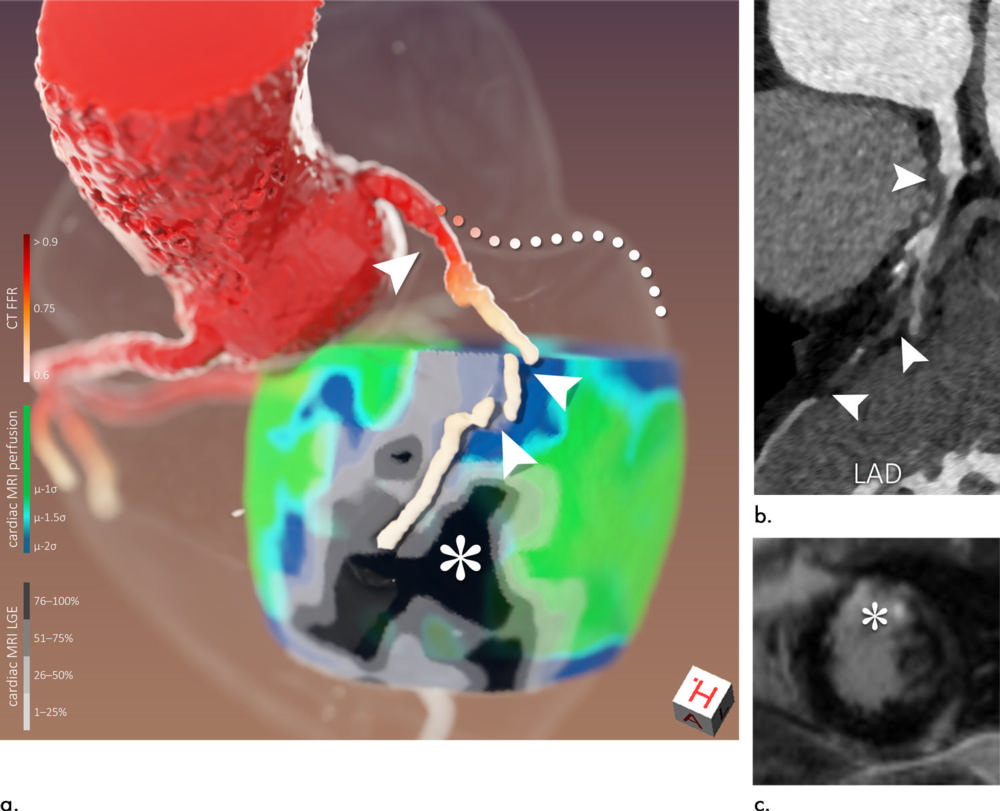
Figure 6. Images of a 56-year-old man (patient 10). Three-dimensional image fusion (a) and conventional two-dimensional images (b: curved multiplanar CT coronary angiography reformation of left anterior descending artery [LAD], c: cardiac MRI late gadolinium enhancement [LGE]). Because of subtotal occlusion of proximal LAD (arrowheads in a and b corresponding to each other), surrounding hypoperfusion can be seen, while myocardial viability is preserved in proximal supply territory (scar transmurality ≤50%). Because of total occlusion of distal LAD, large area of transmural scar has evolved in distal supply territory (* in a and c). Because of proximal stenosis of left circumflex artery (LCx), segmentation algorithm failed to follow course of this vessel (a, dotted line used to visualize presumed course). However, it can be seen that restricted LCx flow is causing myocardial hypoperfusion (a, lateral heart wall) but has not yet caused myocardial scarring of larger extent. CT FFR = CT-derived fractional flow reserve.
High-res (TIF) version
(Right-click and Save As)