MRI Shows Blood Flow Differs in Men and Women
Released: February 27, 2020
At A Glance
- Researchers used 4D flow MRI to study gender differences in the heart’s main pumping chamber.
- Kinetic energy, one indicator of energy expenditure during contraction and filling of the heart, was significantly higher in men.
- Vorticity, a measure of regions of rotating flow that form during different points of the cardiac cycle, was higher in women, as was strain, a measure of left ventricular function.
- RSNA Media Relations
1-630-590-7762
media@rsna.org - Linda Brooks
1-630-590-7738
lbrooks@rsna.org - Dionna Arnold
1-630-590-7791
darnold@rsna.org
OAK BROOK, Ill. — Healthy men and women have different blood flow characteristics in their hearts, according to a new study published in the journal Radiology: Cardiothoracic Imaging. Researchers said the results could be used to help create quantitative standards that adjust for gender to provide improved assessment of cardiac performance.
Differences in the hearts of men and women have long been known. For instance, women’s hearts are smaller in size and beat faster than men’s, on average. However, much less is known about the way that blood flows through the hearts of men and women and how that relates to cardiac performance.
For the new study, researchers used a sophisticated imaging technique called 4D flow MRI to study gender differences in the left ventricle, the heart’s main pumping chamber. They derived various blood flow parameters from MRI scans obtained from 20 men and 19 women and correlated them with cardiac function.
The data showed some significant differences between the genders. Kinetic energy, which is one indicator of energy expenditure during contraction and filling of the heart, was significantly higher in the left ventricles of men. Vorticity, a measure of regions of rotating flow that form during different points of the cardiac cycle, was higher in women, as was strain, a measure of left ventricular function.

“Using the MRI data, we found differences in how the heart contracts in men and women,” said study lead author David R. Rutkowski, Ph.D., postdoctoral researcher at the University of Wisconsin in Madison. “There was greater strain in the left ventricle wall of women and a higher vorticity in the blood volume. We hypothesize that these two things are related.”
The study and the methods it employed have a number of potential applications, Dr. Rutkowski noted, including improved understanding of why the hearts of men and women respond differently to physiological stresses and disease. The results also add information that might one day improve clinical assessment of the heart.
“These blood flow metrics would be useful as reference standards because they are derived from healthy people, so we could use these to compare with someone who is unhealthy,” Dr. Rutkowski said.
Dr. Rutkowski emphasized that the ability of 4D flow MRI to provide numbers for various blood flow parameters is especially important.
“There’s been a push in the last couple of decades to make MRI more quantitative,” he said. “So instead of looking at something and saying it looks normal or different, we can get a number to go with that visual information.”
The researchers are currently using 4D flow MRI to look at patients with atrial fibrillation, an irregular heartbeat that can lead to serious complications. Their hope is that MRI will help detect patterns and relationships in the atria, the upper chambers of the heart, similar to those found in the ventricles.
“The goal of our work in general is to move from qualitative MRI to more quantitative MRI,” Dr. Rutkowski said. “Getting blood flow and velocity information is just one more metric that is being developed to make MRI more quantitative.”
“Sex Differences in Cardiac Flow Dynamics of Healthy Volunteers.” Collaborating with Dr. Rutkowski were Gregory P. Barton, Ph.D., Christopher J. François, M.D., Niti Aggarwal, M.D., and Alejandro Roldán-Alzate, Ph.D.
Radiology: Cardiothoracic Imaging is edited by Suhny Abbara, M.D., University of Texas Southwestern Medical Center, Dallas, and owned and published by the Radiological Society of North America, Inc. (https://pubs.rsna.org/cardiothoracic-imaging)
RSNA is an association of radiologists, radiation oncologists, medical physicists and related scientists promoting excellence in patient care and health care delivery through education, research and technologic innovation. The Society is based in Oak Brook, Ill. (RSNA.org)
For patient-friendly information on cardiac imaging, visit RadiologyInfo.org.
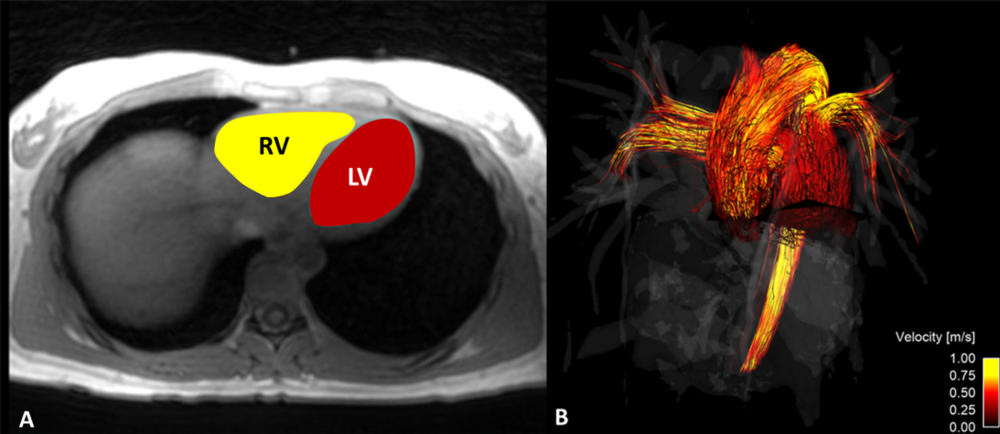
Figure 1. Four-dimensional (4D) flow MRI was used to calculate, A, kinetic energy in the right ventricle (RV) and left ventricle (LV). Time-averaged 4D flow MRI magnitude data were used to segment the RV and LV and, B, flow through the main pulmonary artery and ascending aorta.
High-res (TIF) version
(Right-click and Save As)
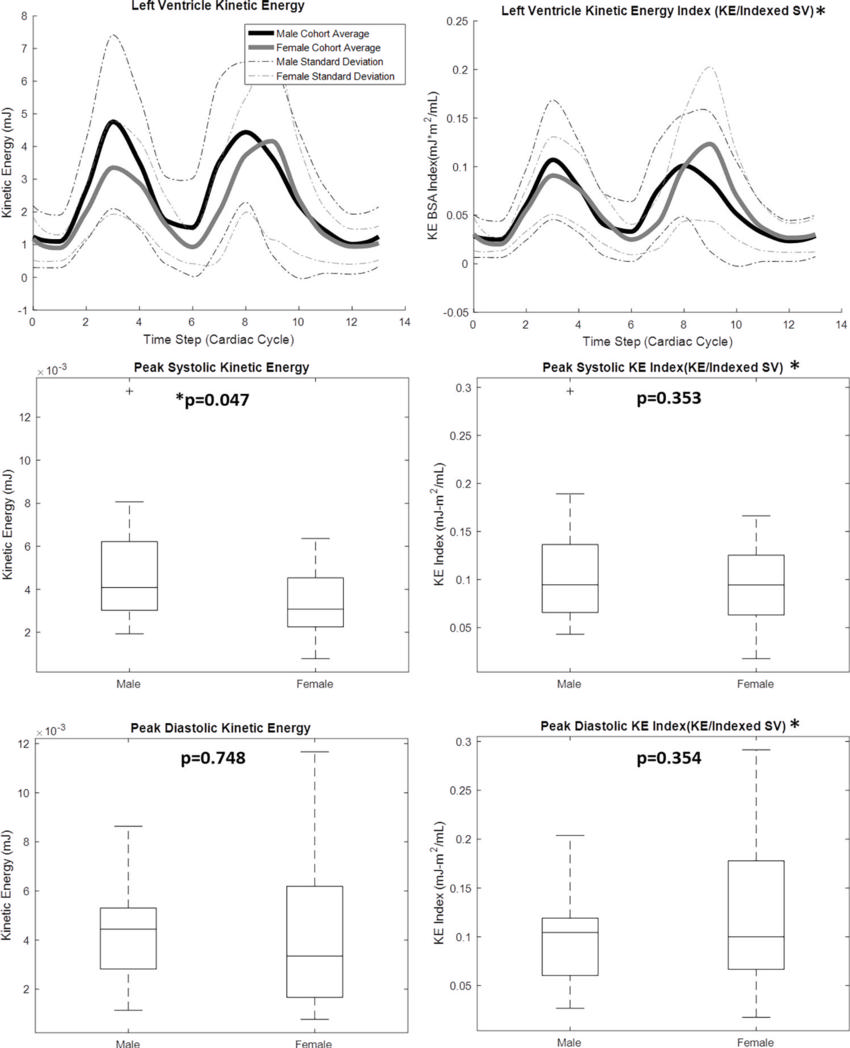
Figure 2. Four-dimensional flow MRI data were used to calculate left ventricular blood flow kinetic energy (KE) throughout the cardiac cycle for 20 healthy men and 19 healthy women. Cardiac function data from two-dimensional short-axis MR images were used, in conjunction with body surface areas (BSAs), to create a KE index parameter. Lines in box plots represent median values. *Indexed data were reported on 35 of the 39 volunteers: BSA was not recorded for four participants. SV = stroke volume.
High-res (TIF) version
(Right-click and Save As)
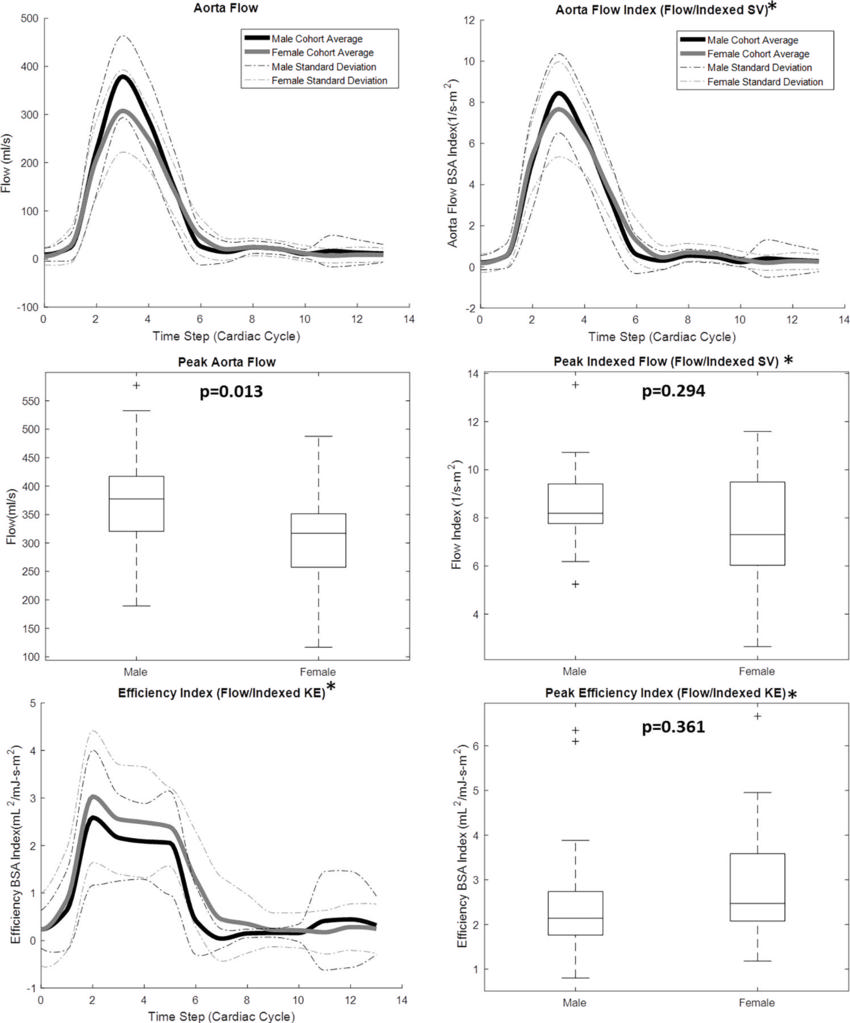
Figure 3. : Four-dimensional flow MRI data were used to calculate aorta flow throughout the cardiac cycle for 20 healthy men and 19 healthy women. Cardiac function data from two-dimensional short-axis MR images were used, in conjunction with body surface areas (BSAs), to create an aorta flow index parameter. *Indexed data were reported on 35 of the 39 volunteers: BSA was not recorded for four participants. Lines in box plots represent median values. KE = kinetic energy, SV = stroke volume.
High-res (TIF) version
(Right-click and Save As)
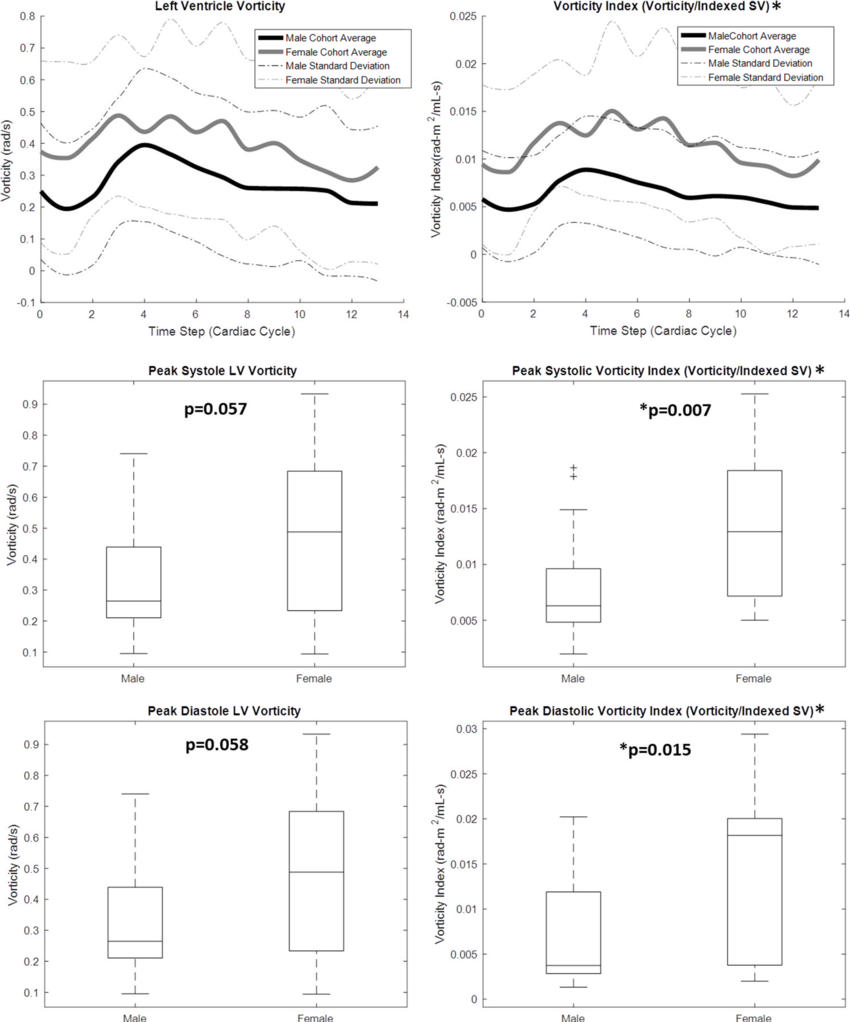
Figure 4. : Four-dimensional flow MRI data were used to calculate left ventricular (LV) blood flow vorticity throughout the cardiac cycle for 20 healthy men and 19 healthy women. Cardiac function data from two-dimensional short-axis MR images were used, in conjunction with volunteer body surface areas (BSAs), to create a vorticity index parameter. *Indexed data were reported on 35 of the 39 volunteers: BSA was not recorded for four participants. Lines in box plots represent median values. SV = stroke volume.
High-res (TIF) version
(Right-click and Save As)
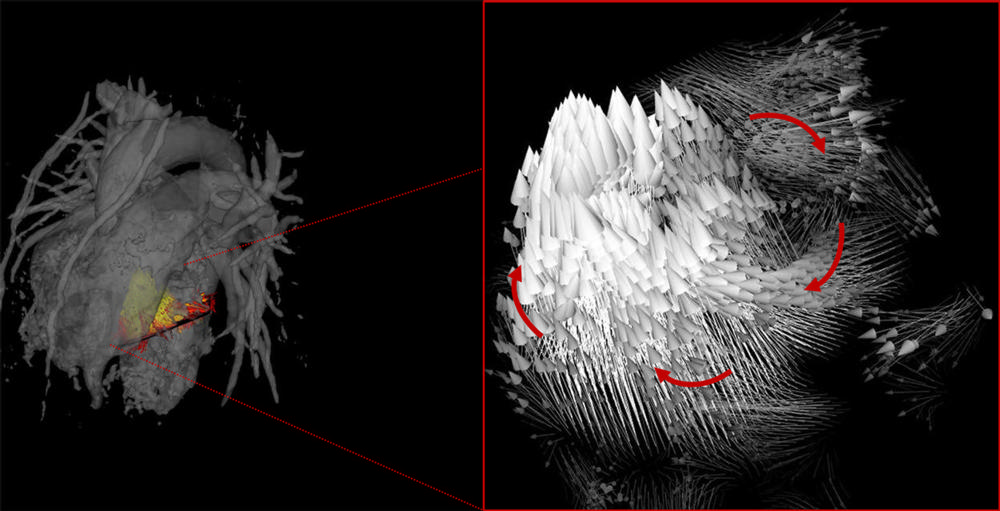
Figure 5. : Four-dimensional flow MRI data were used to create velocity vector visualizations of left ventricle blood flow throughout the cardiac cycle in healthy volunteers. Through this visualization, areas of vortex formation were observed, as emphasized with arrows.
High-res (TIF) version
(Right-click and Save As)
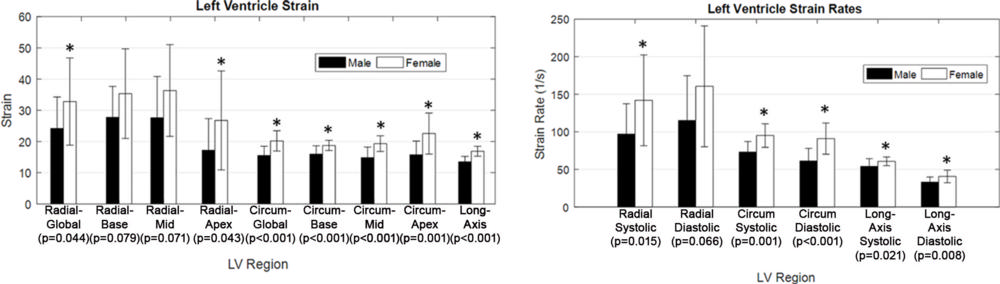
Figure 6. : Cardiac strain was calculated in the radial, circumferential, and long-axis orientation in the left ventricle (LV) of 20 healthy men and 19 healthy women. Additionally, systolic and diastolic strain rates were recorded. *Significant sex-based differences were observed, as noted. Circum = circumferential.
High-res (TIF) version
(Right-click and Save As)
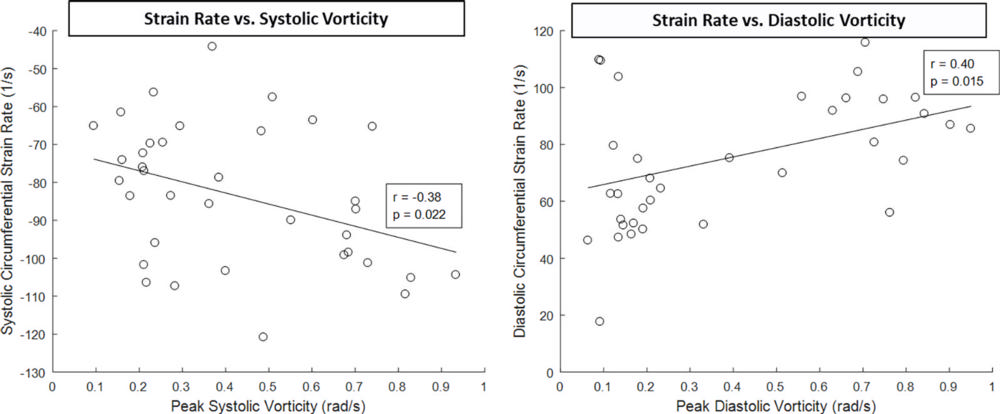
Figure 7. : Left ventricle (LV) strain rates obtained from two-dimensional cine images were compared with LV blood flow kinetic energy derived from four-dimensional flow MRI data. A moderate relationship was observed in both systolic and diastolic phases of the cardiac cycle. Note that increased strain is correlated with increased vorticity in both systole (negative strain) and diastole (positive strain). The sign (positive vs negative) of the strain metrics in systole and diastole is opposite to maintain consistency of wall motion with the designated coordinate direction (wall moving inward in systole and outward in diastole).
High-res (TIF) version
(Right-click and Save As)