Artificial Intelligence Improves Heart Attack Risk Assessment
Released: June 25, 2019
At A Glance
- Machine learning (ML) does better than conventional risk models at predicting heart attacks and other cardiac events.
- Researchers compared the ML approach to other vessel scoring systems in almost 6,900 patients.
- The ML approach better discriminated which patients would go on to have a cardiac event from those who would not.
- RSNA Media Relations
1-630-590-7762
media@rsna.org - Linda Brooks
1-630-590-7738
lbrooks@rsna.org - Dionna Arnold
1-630-590-7791
darnold@rsna.org
OAK BROOK, Ill. — When used with a common heart scan, machine learning (ML), a type of artificial intelligence, does better than conventional risk models at predicting heart attacks and other cardiac events, according to a study published in the journal Radiology.
Heart disease is the leading cause of death for both men and women in the United States. Accurate risk assessment is crucial for early interventions including diet, exercise and drugs like cholesterol-lowering statins. However, risk determination is an imperfect science, and popular existing models like the Framingham Risk Score have limitations, as they don’t directly consider the condition of the coronary arteries.

Coronary computed tomography arteriography (CCTA), a kind of CT that gives highly detailed images of the heart vessels, is a promising tool for refining risk assessment—so promising that a multidisciplinary working group recently introduced a scoring system for summarizing CCTA results. The decision-making tool, known as the coronary artery disease reporting and data system (CAD-RADS), emphasizes stenoses, or blockages and narrowing in the coronary arteries. While CAD-RADS is an important and useful development in the management of cardiac patients, its focus on stenoses may leave out important information about the arteries, according to study lead author Kevin M. Johnson, M.D., associate professor of radiology and biomedical imaging at the Yale School of Medicine in New Haven, Conn.
Noting that CCTA shows more than just stenoses, Dr. Johnson recently investigated an ML system capable of mining the myriad details in these images for a more comprehensive prognostic picture.
“Starting from the ground up, I took imaging features from the coronary CT,” he said. “Each patient had 64 of these features and I fed them into a machine learning algorithm. The algorithm is able to pull out the patterns in the data and predict that patients with certain patterns are more likely to have an adverse event like a heart attack than patients with other patterns.”
For the study, Dr. Johnson and colleagues compared the ML approach with CAD-RADS and other vessel scoring systems in 6,892 patients. They followed the patients for an average of nine years after CCTA. There were 380 deaths from all causes, including 70 from coronary artery disease. In addition, 43 patients reported heart attacks.
Compared to CAD-RADS and other scores, the ML approach better discriminated which patients would have a cardiac event from those who would not. When deciding whether to start statins, the ML score ensured that 93 percent of patients with events would receive the drug, compared with only 69 percent if CAD-RADS were relied on.
“The risk estimate that you get from doing the machine learning version of the model is more accurate than the risk estimate you’re going to get if you rely on CAD-RADS,” Dr. Johnson said. “Both methods perform better than just using the Framingham risk estimate. This shows the value of looking at the coronary arteries to better estimate people’s risk.”
If machine learning can improve vessel scoring, it would enhance the contribution of noninvasive imaging to cardiovascular risk assessment. Additionally, the ML-derived vessel scores could be combined with non-imaging risk factors such as age, gender, hypertension and smoking to develop more comprehensive risk models. This would benefit both physicians and patients.
“Once you use a tool like this to help see that someone’s at risk, then you can get the person on statins or get their glucose under control, get them off smoking, get their hypertension controlled, because those are the big, modifiable risk factors,” he said.
Dr. Johnson is currently working on a paper that takes results from this study and folds them into the bigger picture with non-imaging risk factors.
“If you add people’s ages and particulars like smoking, diabetes and hypertension, that should increase the overall power of the method and improve the overall results,” he said.
“Scoring of Coronary Artery Disease Characteristics on Coronary CT Angiograms by Using Machine Learning.” Collaborating with Dr. Johnson were Hilary E. Johnson, B.A., Yang Zhao, Ph.D., David A. Dowe, M.D., and Lawrence H. Staib, Ph.D.
Radiology is edited by David A. Bluemke, M.D., Ph.D., University of Wisconsin School of Medicine and Public Health, Madison, Wis., and owned and published by the Radiological Society of North America, Inc. (https://pubs.rsna.org/journal/radiology)
RSNA is an association of over 53,400 radiologists, radiation oncologists, medical physicists and related scientists promoting excellence in patient care and health care delivery through education, research and technologic innovation. The Society is based in Oak Brook, Ill. (RSNA.org)
For patient-friendly information on CCTA, visit RadiologyInfo.org.
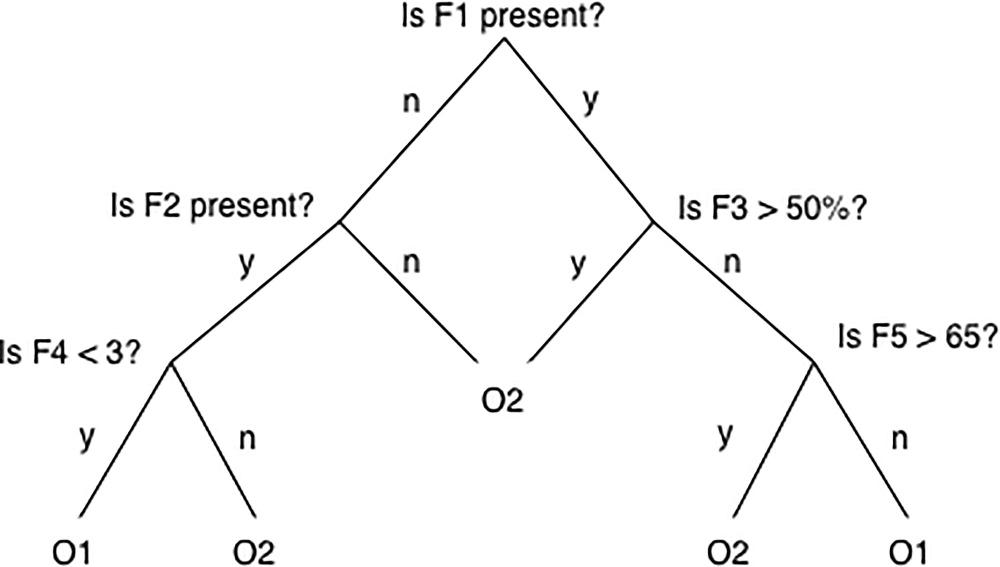
Figure 1. Simple decision tree. In a simple decision tree, a decision is made at each node, or branching point, based on whether some vessel feature (F) is present or is beyond some threshold. The outcome classes O1 and O2 (e.g., death or no death) occupy the tips of the distal branches. A tree can be designed (i.e., trained) on data from patients with known features and outcomes, and then data from a new patient can be run through the tree to predict the likely outcome.
High-res (TIF) version
(Right-click and Save As)
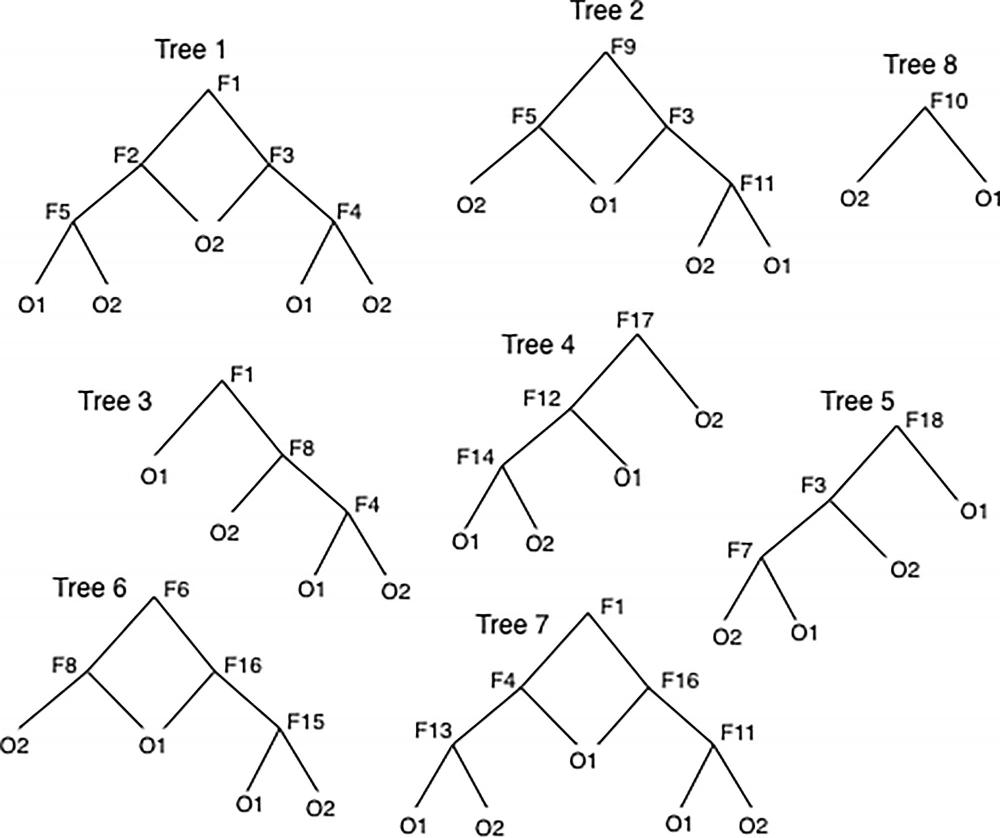
Figure 2. Bagged trees. Bootstrap aggregated trees, or bagged trees, are a collection of simple, weakly predictive decision trees for which a variety of vessel features (F) act at branch points. Not all patient data are used in all trees; data are subsampled by using a bootstrap method. When a new patient’s data are run down through a given tree, that tree predicts an output class O1 or O2 (e.g., death or no death). The consensus of outcomes from all the trees is used as the predicted outcome for the new patient. The collection of trees predicts substantially better than does a simple tree.
High-res (TIF) version
(Right-click and Save As)
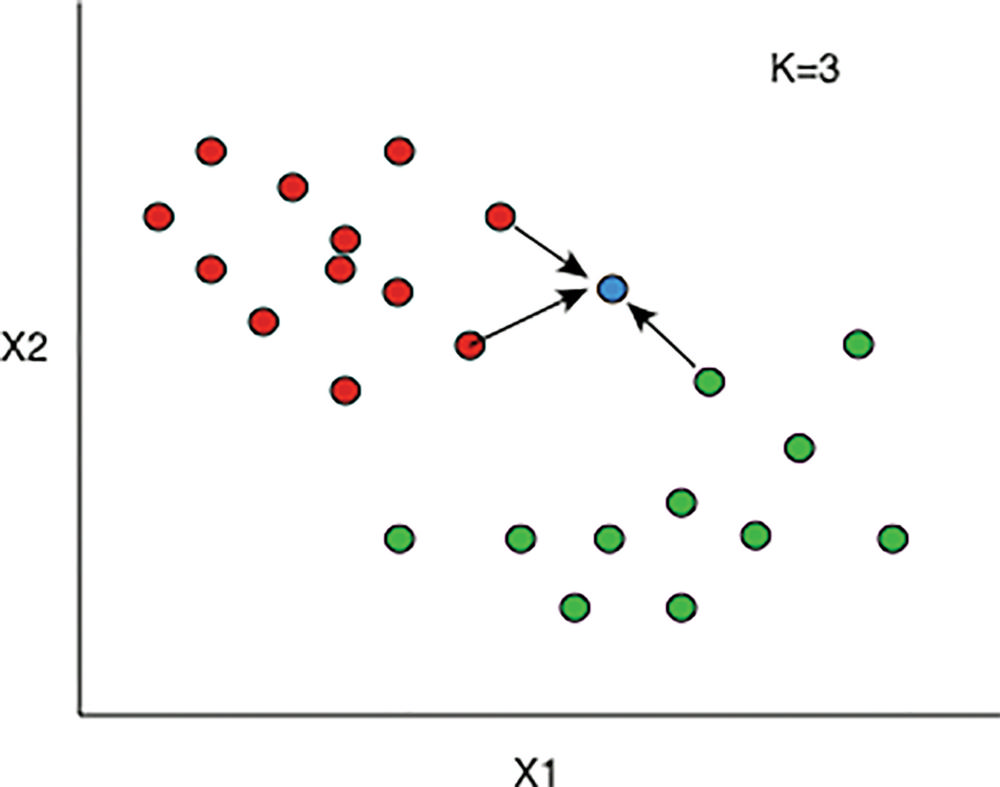
Figure 3. K-nearest neighbors. In this simplified example, there are two vessel features, X1 and X2, each of which have some value along the x- or y-axis, respectively. Patients with existing data and known outcomes each contribute one dot. The patients with red dots had death as an outcome, and those with a green dot did not. The blue dot represents a new patient with unknown outcome. The nearest neighbor algorithm looks at the K dots closest to the blue dot. In this example K = 3; of the three closest dots, two are red and one is green. The algorithm therefore outputs death as the likely outcome because of the three closest dots, the red dots outnumber the green dots.
High-res (TIF) version
(Right-click and Save As)
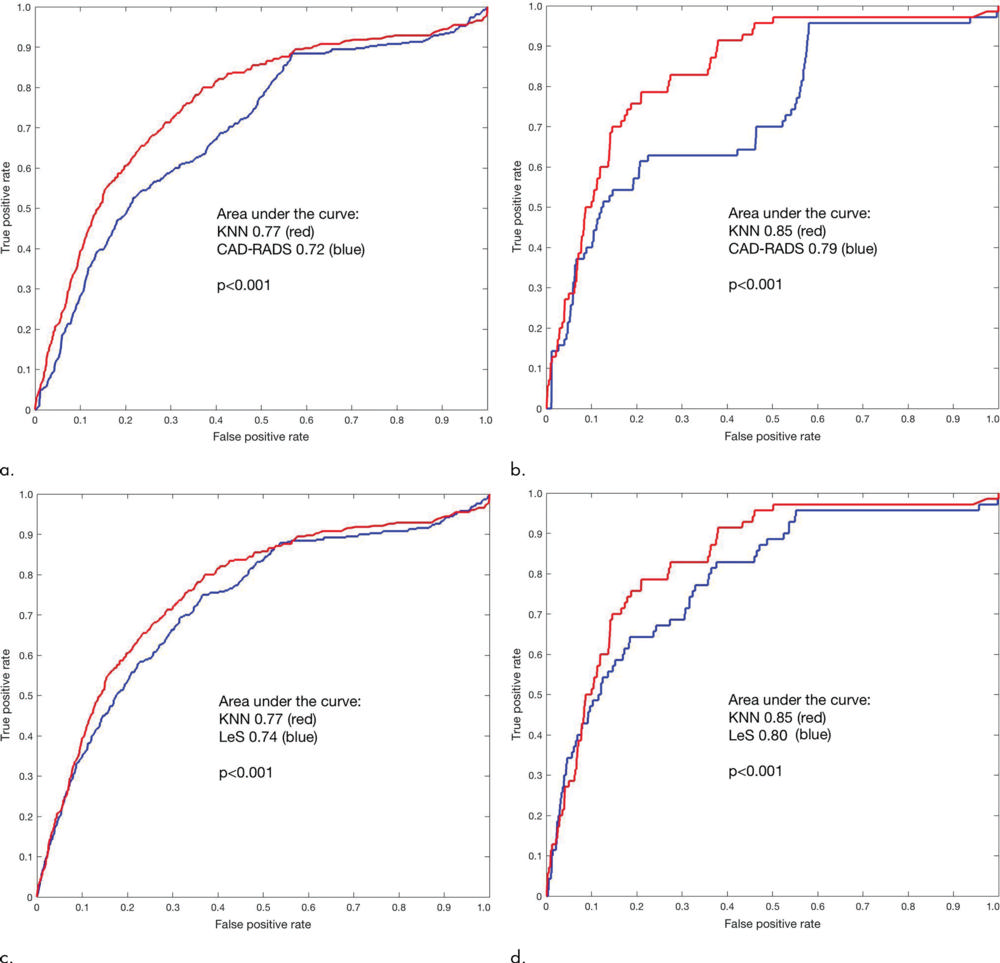
Figure 4. Receiver operating characteristic curves. The machine learning score (k-nearest neighbors [KNN]) gives a larger area under the receiver operating characteristic curve than does the Coronary Artery Disease Reporting and Data System (CAD-RADS) score (P < .001) for (a) all-cause mortality and (b) coronary deaths. KNN gives a larger area under the curve than does the CT Leaman score (LeS; P < .001) for (c) all-cause mortality and (d) coronary deaths.
High-res (TIF) version
(Right-click and Save As)
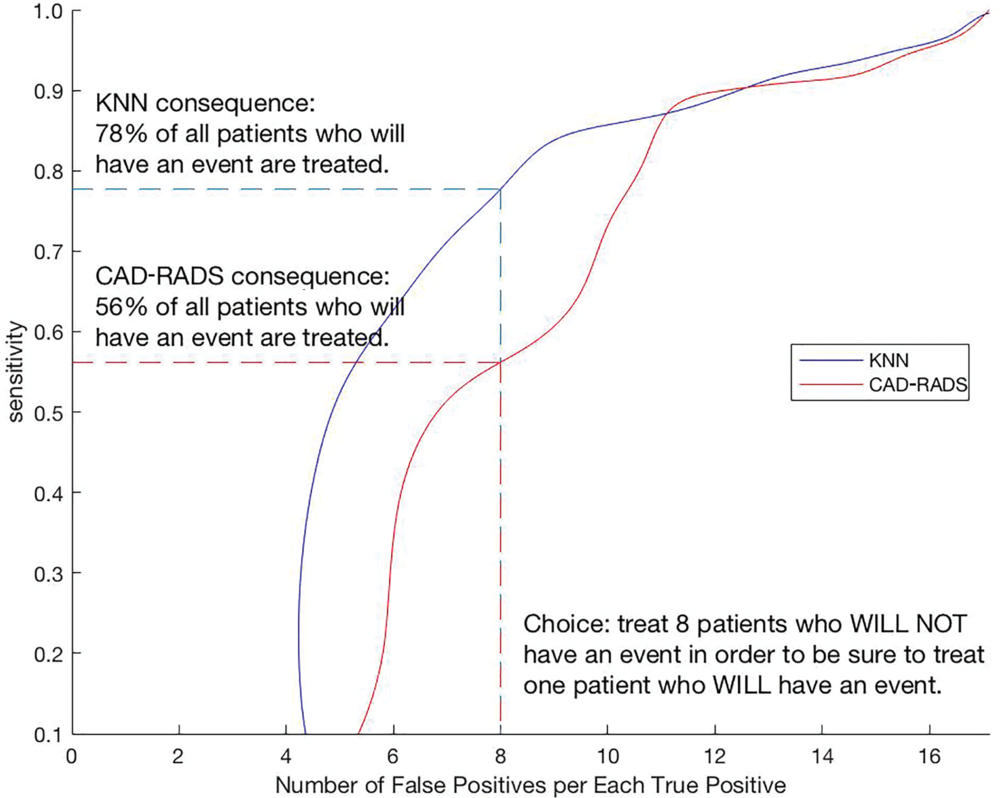
Figure 5. Clinical benefit of the use of machine learning score versus Coronary Artery Disease Reporting and Data System (CAD-RADS) score in all-cause mortality. By adding prevalence information to receiver operating characteristic information, curves can be generated for CAD-RADS and machine learning model k-nearest neighbors (KNN). On the x-axis, the clinician chooses how many patients he or she is willing to treat (e.g., with statins) to be sure to treat one patient who will in fact go on to have an event (false-positive findings vs true-positive findings). The consequence is interpreted on the y-axis. In this example, the use of the KNN curve results in treating 78 percent of the patients who go on to an event whereas the use of the CAD-RADS curve results in treating only 56 percent. The number of false-positive cases increases from left to right, until eventually it means we have decided to treat every patient (sensitivity would be 100 percent and imaging would not have any role).
High-res (TIF) version
(Right-click and Save As)
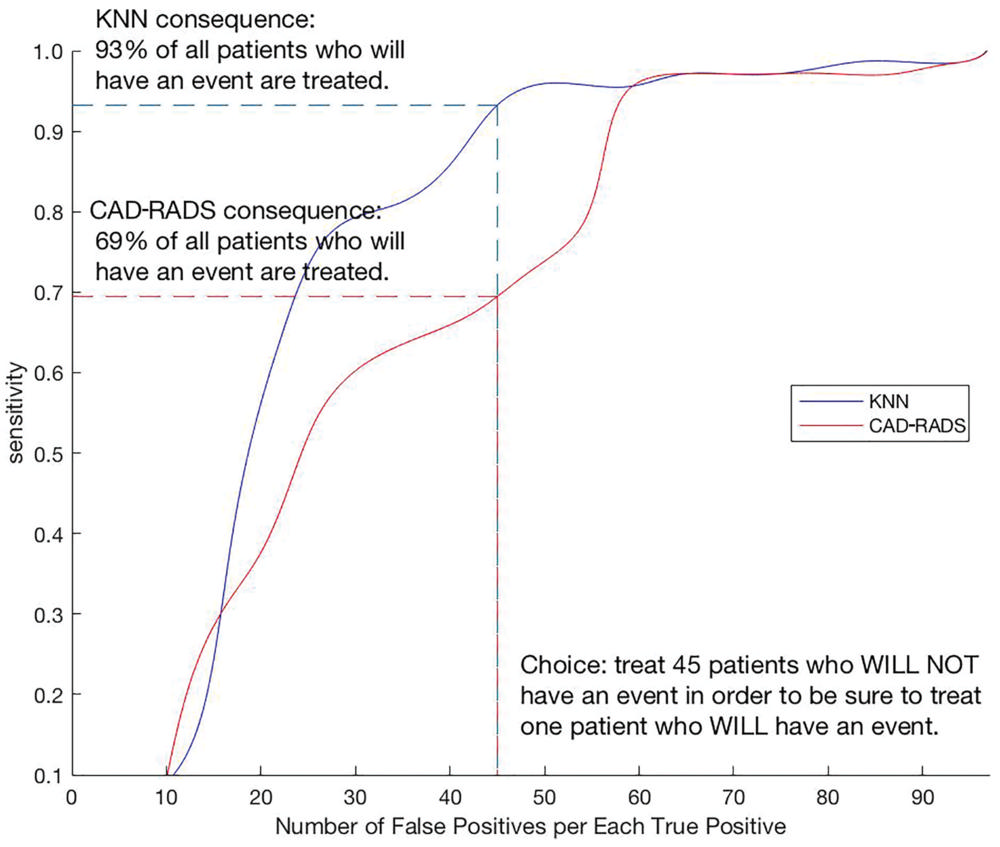
Figure 6. Clinical benefit of the use of machine learning k-nearest neighbors score (KNN) versus Coronary Artery Disease Reporting and Data System (CAD-RADS) score for coronary heart disease deaths. For the coronary heart disease death outcomes, use of KNN results in treating 93 percent of the patients who experience an event but the use of the CAD-RADS score results in treating only 69 percent of those patients.
High-res (TIF) version
(Right-click and Save As)