Obesity Linked with Differences in Form and Structure of the Brain
Released: April 23, 2019
At A Glance
- MRI shows that higher levels of body fat are associated with differences in the brain's form and structure.
- Brain imaging results from more than 12,000 participants in the UK Biobank study were analyzed.
- Researchers found that higher total body fat percentage increased the likelihood of changes to the brain's white matter. In men, gray matter volume was also reduced.
- RSNA Media Relations
1-630-590-7762
media@rsna.org - Linda Brooks
1-630-590-7738
lbrooks@rsna.org - Dionna Arnold
1-630-590-7791
darnold@rsna.org
OAK BROOK, Ill. — Researchers using sophisticated MRI technology have found that higher levels of body fat are associated with differences in the brain's form and structure, including smaller volumes of gray matter, according to a study published in the journal Radiology. The findings add important information to our understanding of the connection between obesity and negative health consequences such as dementia.

"MRI has shown to be an irreplaceable tool for understanding the link between neuroanatomical differences of the brain and behavior," said study lead author Ilona A. Dekkers, M.D., from Leiden University Medical Center in Leiden, the Netherlands. "Our study shows that very large data collection of MRI data can lead to improved insight into exactly which brain structures are involved in all sorts of health outcomes, such as obesity."
Obesity represents one of the world's most challenging public health problems. The global pandemic has led to a greater incidence of cardiovascular disease and type 2 diabetes. Previous studies have also tied obesity to an increased risk of accelerated cognitive decline and dementia, suggesting that the disease causes changes to the brain.
To learn more about these changes, the researchers analyzed brain imaging results from more than 12,000 participants in the UK Biobank study, a major trial begun in 2006 to learn more about the genetic and environmental factors that influence disease. The brain scans used sophisticated MRI techniques that provided information on both the neuron-rich gray matter and the white matter, often referred to as the wiring of the brain.
The results show some clear associations in the patients between body fat percentage and brain form and structure, also known as its morphology.
"We found that having higher levels of fat distributed over the body is associated with smaller volumes of important structures of the brain, including gray matter structures that are located in the center of the brain," Dr. Dekkers said. "Interestingly, we observed that these associations are different for men and women, suggesting that gender is an important modifier of the link between fat percentage and the size of specific brain structures."
Analysis showed that, in men, higher total body fat percentage correlated with lower gray matter volume overall and in specific structures involved in the reward circuitry and the movement system. In women, total body fat only showed a significant negative association with the globus pallidus, a structure involved in voluntary movement. For both men and women, higher total body fat percentage increased the likelihood of microscopic changes to the brain's white matter.
The ramifications of these findings, not yet fully clear, could be of significant importance. Smaller gray matter volume suggests loss of neurons, and changes to the white matter could adversely affect the transmission of signals within brain networks. Since the smaller subcortical grey matter volumes are also known to play a role in the food-reward circuitry, these changes may also make it more difficult for obese people to control their weight, Dr. Dekkers said, although more research will be needed to support that connection.
The reason for obesity's adverse effects on the brain are not precisely known. Research has shown that the low-grade inflammation characteristic of obesity can have harmful effects on brain tissue. There is evidence that cellular responses produced in the brain due to inflammation may be behind these effects.
The study looked at overall body fat percentage and did not distinguish between the different types of fat in the body, which Dr. Dekkers said may be an area for additional research. Of particular interest is the visceral white fat found around the abdominal organs. This type of fat, also known as belly fat, is part of metabolic syndrome, a group of factors that increase the risk of cardiovascular disease and diabetes.
"For future research, it would be of great interest whether differences in body fat distribution are related to differences in brain morphological structure, as visceral fat is a known risk factor for metabolic disease and is linked to systemic low-grade inflammation," said the study's senior author, Hildo Lamb, M.D., Ph.D., director of the Cardio Vascular Imaging Group of Leiden University Medical Center.
"Obesity, Brain Volume, and White Matter Microstructure at MRI: A Cross-sectional UK Biobank Study." Collaborating with Drs. Dekkers and Lamb was Philip R. Jansen, M.D., M.Sc.
Radiology is edited by David A. Bluemke, M.D., Ph.D., University of Wisconsin School of Medicine and Public Health, Madison, Wis., and owned and published by the Radiological Society of North America, Inc. (http://radiology.rsna.org/)
RSNA is an association of over 53,400 radiologists, radiation oncologists, medical physicists and related scientists, promoting excellence in patient care and health care delivery through education, research and technologic innovation. The Society is based in Oak Brook, Ill. (RSNA.org)
For patient-friendly information on brain MRI, visit RadiologyInfo.org.
Images (.JPG and .TIF format)
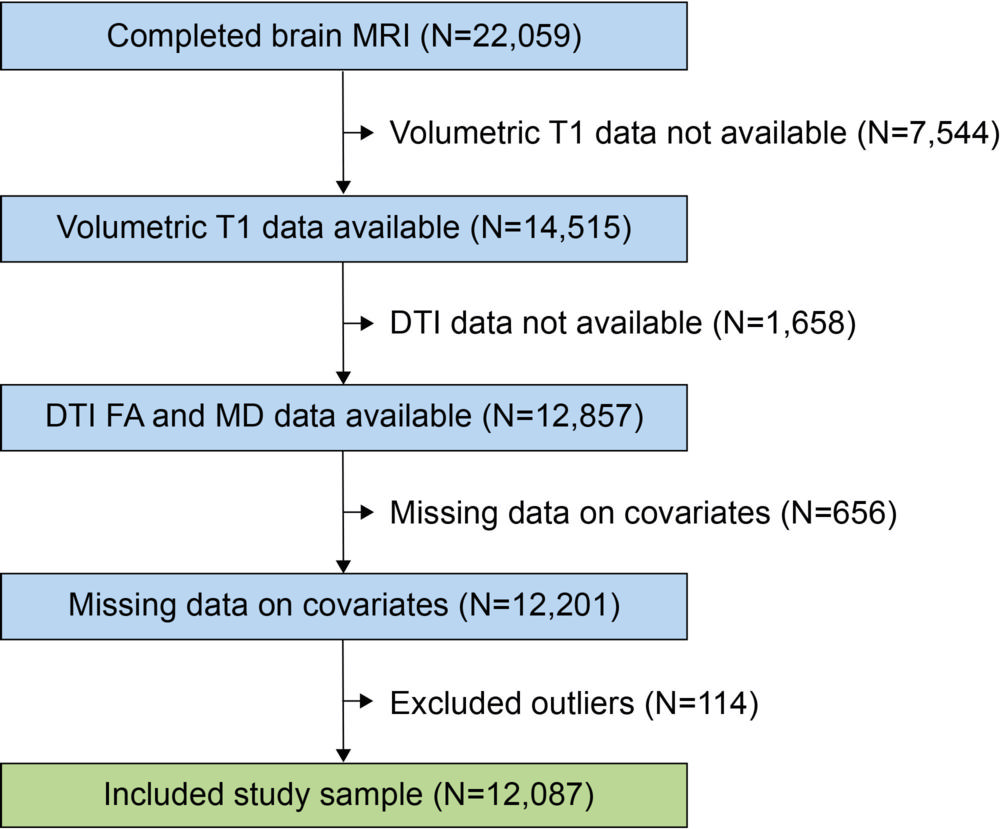
Figure 1. Strengthening the Reporting of Observational Studies in Epidemiology flow diagram of UK Biobank study. DTI = diffusion tensor imaging, FA = fractional anisotropy, MD = mean diffusivity.
High-res (TIF) version
(Right-click and Save As)
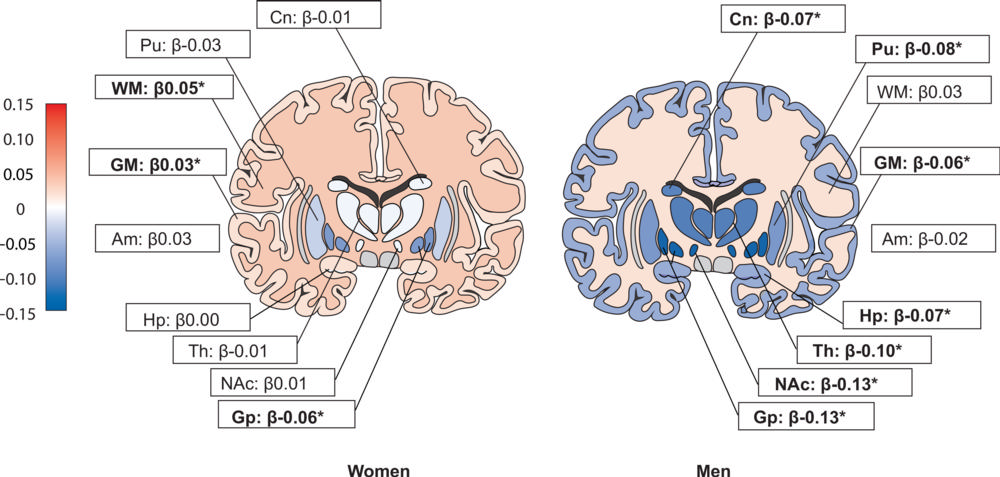
Figure 2. Overview of observed standardized regression coefficients (b value, scale from red to blue) for the associations between total body fat and specific brain regions for men and women. Standardized regression coefficients reflect the standard deviation change in regional brain volume per standard deviation (6.5 percent in women and 5.5 percent in men) change in total body fat. Example of interpretation, in men per standard deviation greater total body fat globus pallidus volume was 27.2 mm3 lower, and in women per standard deviation greater total body fat globus pallidus volume was 11.2 mm3 lower. Results were adjusted for age, ethnicity, Townsend deprivation index, assessment center (baseline visit and imaging visit), smoking, alcohol use, diabetes, cardiovascular disease, and intracranial volume. ∗ Significant after false discovery rate correction (threshold false discovery rate P = .023). Am = amygdala, Cn = caudate nucleus, GM = gray matter, Gp = globus pallidus, Hp = hippocampus, NAc = nucleus accumbens, Pu = putamen, Th = thalamus, WM = white matter.
High-res (TIF) version
(Right-click and Save As)
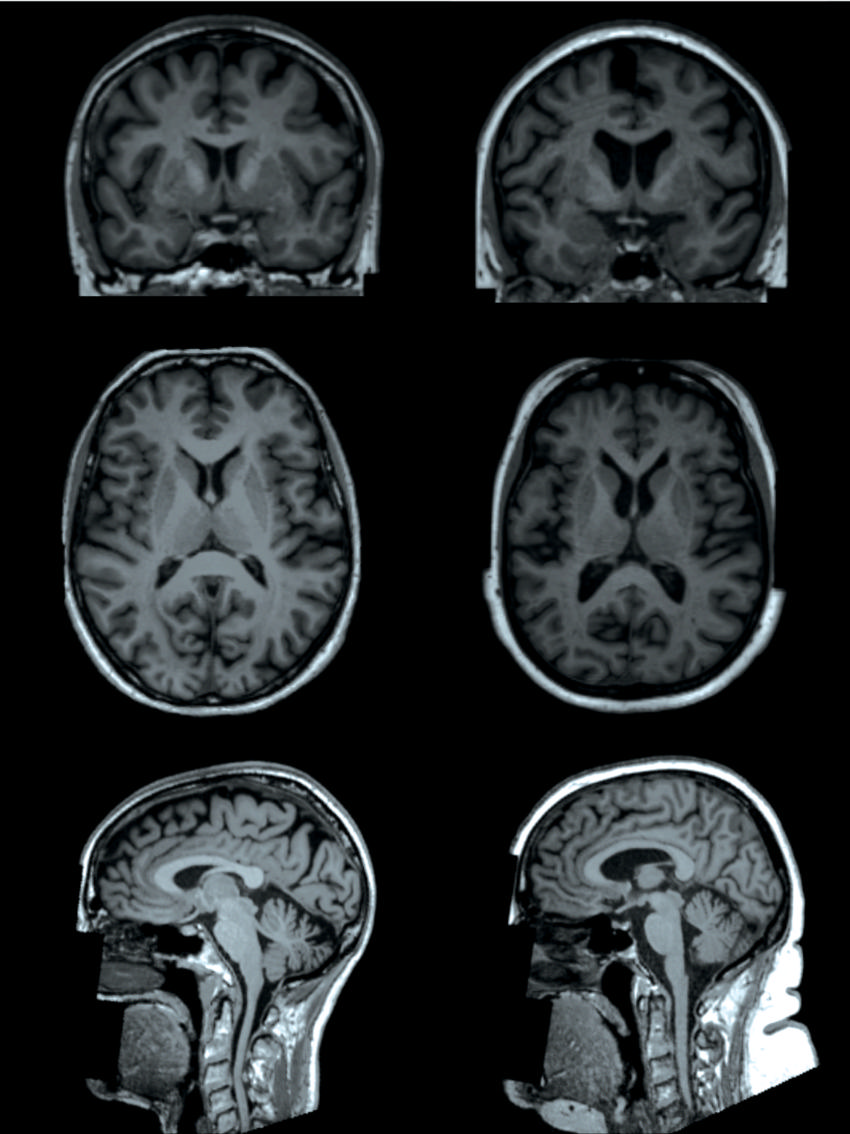
Figure 3. T1-weighted brain MRI examples (coronal, top; axial, middle; and sagittal, bottom) of two participants in the UK biobank study (both women and age 65 years), one participant with a body fat percentage of 13 percent (left) and one participant with a body fat percentage of 49 percent (right). MRI image shows lower volumes of subcortical gray matter structures in the individual with higher total body fat percentage (right).
High-res (TIF) version
(Right-click and Save As)
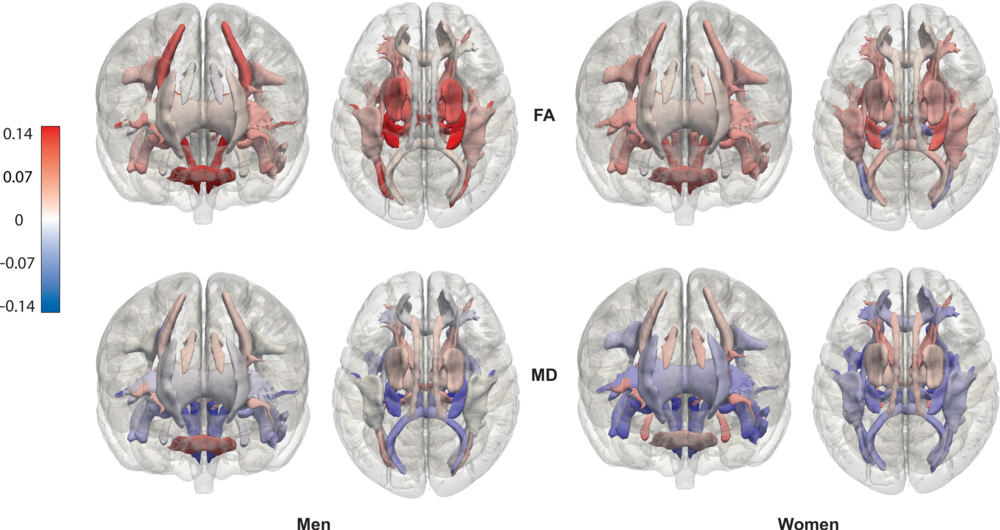
Figure 4. Overview of observed standardized regression coefficients (b values) for the associations between total body fat and fractional anisotropy (FA)–and mean diffusivity (MD)–based DTI tracts for men and women. Standardized regression coefficients reflect the standard deviation (SD) change in FA and MD, respectively, per standard deviation (6.5 percent in women and 5.5 percent in men) change in total body fat. Results were adjusted for age, ethnicity, Townsend deprivation index, assessment center (baseline visit and imaging visit), smoking, alcohol use, diabetes, cardiovascular disease, and intracranial volume.
High-res (TIF) version
(Right-click and Save As)