High-strength MRI Tracks MS Progression
Released: April 09, 2019
At A Glance
- Research suggests a role for ultra-high-field-strength MRI in evaluating the progression of MS.
- Twenty-five of the MS patients in the study developed new cortical lesions.
- Volume of cortical lesions was a predictor of neurological disability.
- RSNA Media Relations
1-630-590-7762
media@rsna.org - Linda Brooks
1-630-590-7738
lbrooks@rsna.org - Dionna Arnold
1-630-590-7791
darnold@rsna.org
OAK BROOK, Ill. — The development of scars, or lesions, in the brain's cortical gray matter is a powerful predictor of neurological disability for people with multiple sclerosis (MS), according to study appearing in the journal Radiology. Researchers said that the findings suggest a role for ultra-high-field-strength MRI in evaluating the progression of MS.

MS is a disease in which the body's immune system attacks the protective covering surrounding the nerves of the central nervous system. It was once considered a disease of the brain's white matter, but recent research has shown that cortical lesions, or lesions in the gray matter of the outer layer of the brain, develop even earlier in the course of the disease. These lesions are not easy to see with conventional-strength MRI.
For the new study, researchers tracked MS patients using a 7-Tesla (T) MRI scanner—an extremely powerful machine that has more than twice the magnetic field strength of the more commonly available 3T scanners.
"Because 7T MRI is more sensitive to cortical lesions than lower-field MRI, we can detect many of these lesions that we couldn't see before and determine if they are strongly correlated with neurological disability and disease progression," said study senior author Caterina Mainero, M.D., Ph.D., from the Athinoula A. Martinos Center for Biomedical Imaging at Massachusetts General Hospital in Boston. "In this study, we wanted to track the evolution of these lesions and better understand where in the cortex these lesions develop more frequently."
Dr. Mainero and colleagues followed 20 relapsing-remitting and 13 secondary-progressive MS patients over time, along with 10 age-matched healthy controls. Relapsing-remitting is a type of MS in which the symptoms sometimes improve and sometimes worsen, while secondary-progressive is characterized by more significant disability.
Twenty-five of the MS patients, or 80 percent, developed new cortical lesions, and the 7T MRI detected them more frequently compared to previous studies at lower-field MRI strength. On average, the number of lesions that developed in the cortical region was more than twice the number that developed in the brain's white matter. The total volume of cortical lesions was a predictor of neurological disability at both baseline and follow-up assessment.
The 7T brain scans showed that the cortical lesions tended to accumulate in grooves on the brain's surface called sulci.
"We showed that the cortical sulci are the regions where most of these lesions develop," Dr. Mainero said. "We also found that these lesions can predict disability progression more than white matter lesions, which are the typical lesions of MS we've been studying for years."
While the reasons for the accumulation of lesions in the sulci are not definitively known, researchers note that the flow of cerebrospinal fluid—the fluid that surrounds the brain and spine—is likely to be restricted there. The restricted flow might make the sulci more vulnerable to inflammatory responses.
The results suggest that assessment of cortical lesions should represent a main component in the evaluation of progression of disease burden in MS, Dr. Mainero said.
"This can have a very powerful impact on how we monitor patients with MS," she said. "We can also use this tool to see how potential treatments can affect the development and evolution of cortical lesions."
The researchers are looking to replicate their data in larger populations. They also hope to learn more about which patients tend to accumulate more lesions and what factors may be behind the inflammatory response.
"This approach adds another piece to the puzzle of understanding MS," Dr. Mainero said.
"Longitudinal Characterization of Cortical Lesion Development and Evolution in Multiple Sclerosis with 7.0-T MRI." Collaborating with Dr. Mainero were Constantina A. Treaba, M.D., Ph.D., Tobias E. Granberg, M.D., Ph.D., Maria Pia Sormani, Ph.D., Elena Herranz, Ph.D., Russell A. Ouellette, B.S., Céline Louapre, M.D., Ph.D., Jacob A. Sloane, M.D., Ph.D., and Revere P. Kinkel, M.D.
Radiology is edited by David A. Bluemke, M.D., Ph.D., University of Wisconsin School of Medicine and Public Health, Madison, Wis., and owned and published by the Radiological Society of North America, Inc. (http://radiology.rsna.org/)
RSNA is an association of over 53,400 radiologists, radiation oncologists, medical physicists and related scientists, promoting excellence in patient care and health care delivery through education, research and technologic innovation. The Society is based in Oak Brook, Ill. (RSNA.org)
For patient-friendly information on brain MR, visit RadiologyInfo.org.
Images (.JPG and .TIF format)
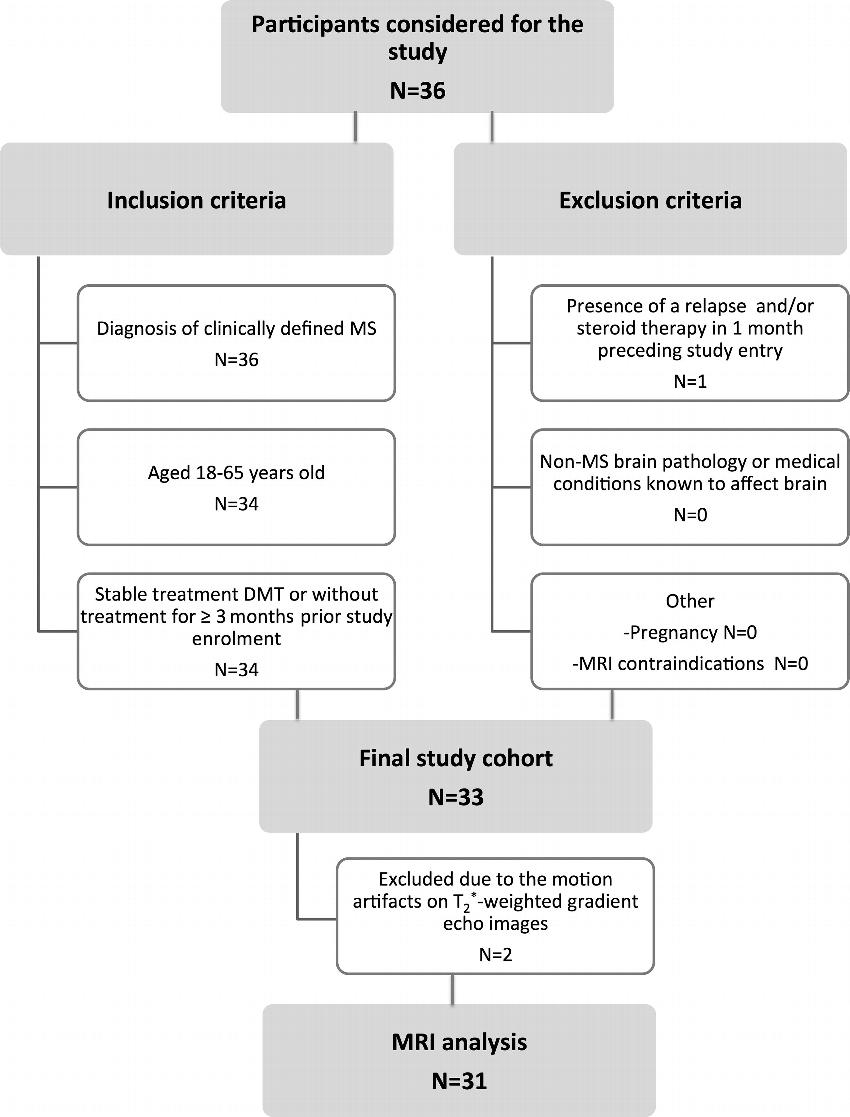
Figure 1. Flowchart shows inclusion and exclusion criteria. DMT = disease-modifying therapies, MS = multiple sclerosis.
High-res (TIF) version
(Right-click and Save As)
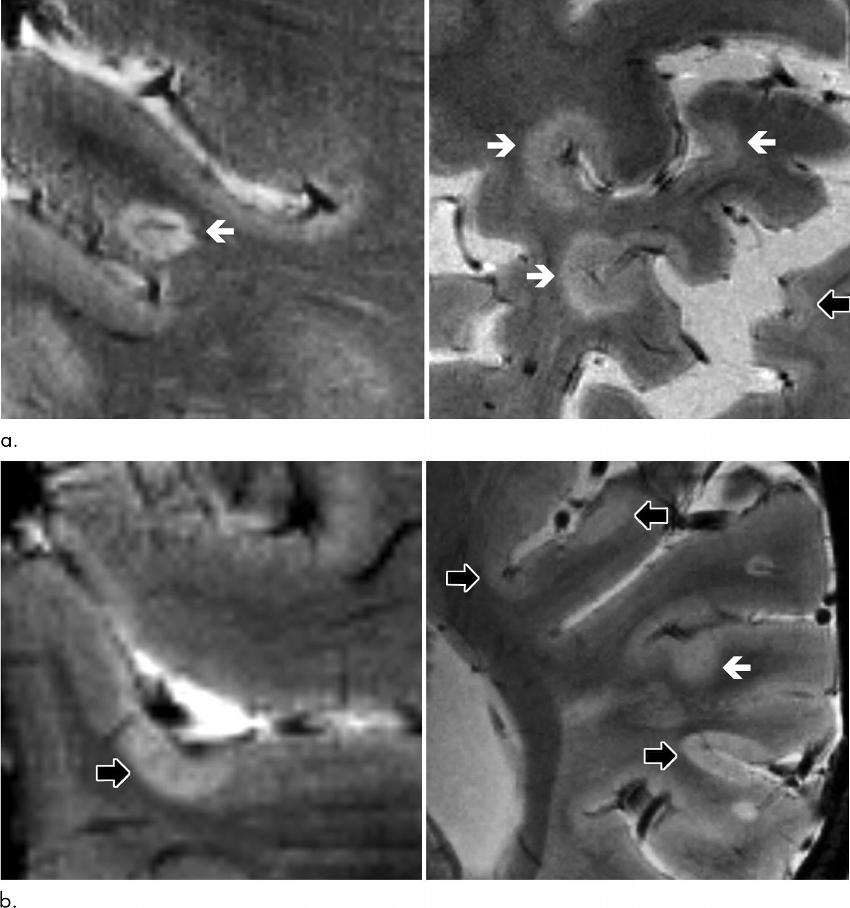
Figure 2. Axial 7.0-T T2*-weighted images show examples of leukocortical lesions (white arrows) and intracortical lesions (black arrows) along with juxtacortical and periventricular white matter lesions in different patients with multiple sclerosis (MS). (a) Images of two different brain locations in a 59-year-old man with secondary progressive MS (SPMS). (b) Images of two different brain locations in a 40-year-old woman with SPMS.
High-res (TIF) version
(Right-click and Save As)

Figure 3. Spatial distribution of vertex-wise frequency of intracortical and leukocortical lesions in 31 patients with multiple sclerosis at baseline and at follow-up. The lesion frequency is displayed for every voxel in the color overlay on "fsaverage." The number of patients showing cortical lesions in a particular voxel is specified by the bar. Maximum overlap (arrows) corresponds to lesions in 10 percent (three of 31) of patients. Despite the scattered distribution, cortical lesions are mainly confined within cortical sulci (shown as dark gray areas) while cortical gyri (shown as light gray areas) are less involved.
High-res (TIF) version
(Right-click and Save As)
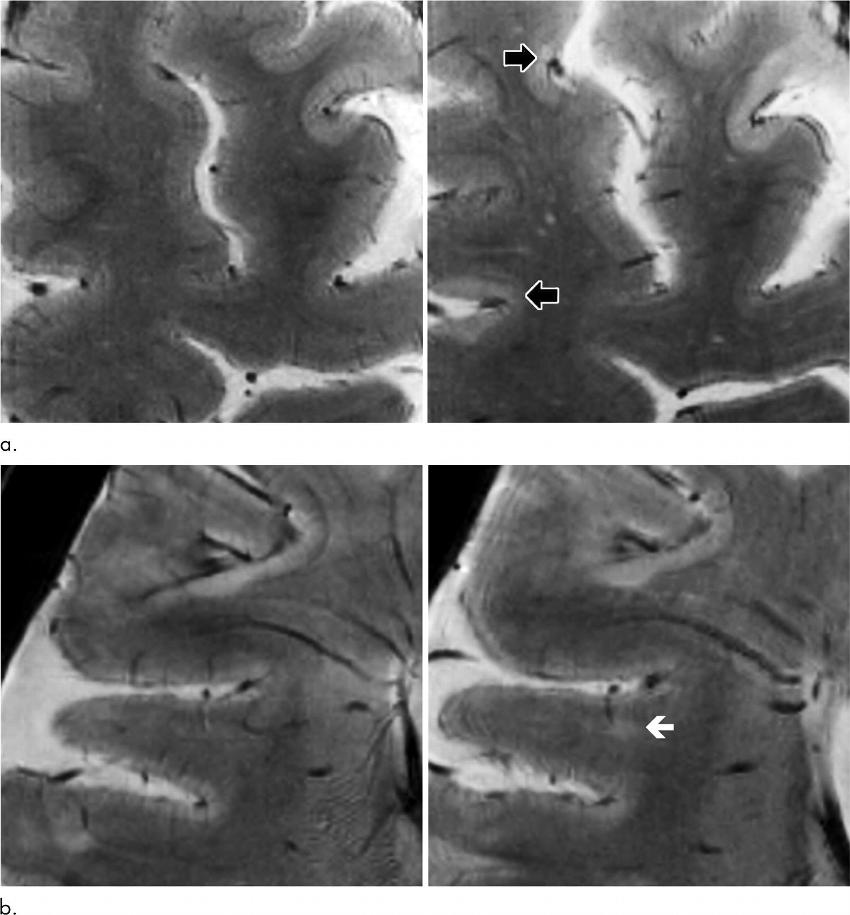
Figure 4. Axial high-resolution T2*-weighted images acquired at 7.0-T MRI. (a) Comparison of images at baseline (left panel) and 1.5-year follow-up (right panel) in a 52-year-old woman with secondary progressive multiple sclerosis (disease duration of 21 years) shows development of two intracortical lesions (black arrows) at follow-up. (b) Comparison of images at baseline (left panel) and 1.4-year follow-up (right panel) in a 43-year-old woman with relapsing-remitting multiple sclerosis (disease duration of 8 years) shows a new leukocortical lesion (white arrow) at follow-up.
High-res (TIF) version
(Right-click and Save As)
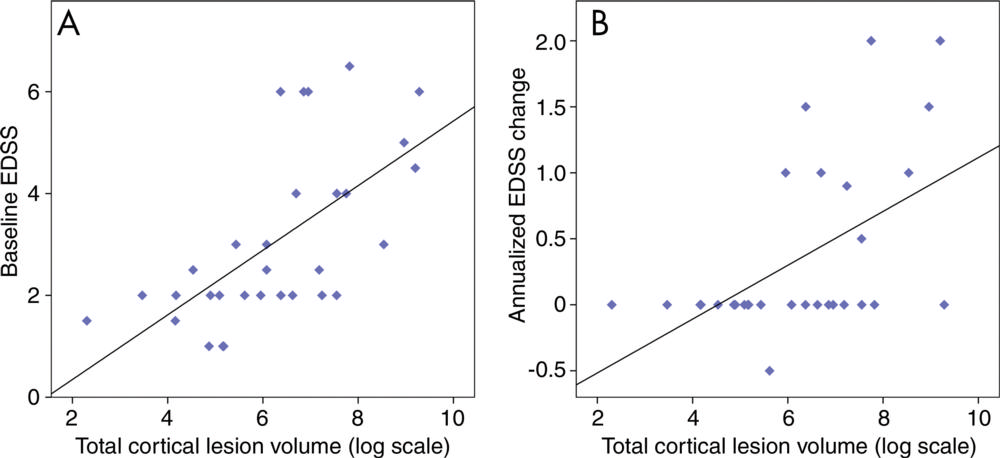
Figure 5. Scatter plots showing the univariable association between baseline total cortical lesion volume and, A, baseline EDSS and, B, EDSS change. Stepwise regression analysis shows that baseline total cortical lesion volume was retained as the only independent predictor of baseline EDSS score (P ˂ .001, R2 = 0.27) and EDSS changes at follow-up (P = .003, R2 = 0.23). EDSS = Expanded Disability Status Scale.
High-res (TIF) version
(Right-click and Save As)