Researchers Use Radiomics to Predict Who Will Benefit from Chemotherapy
Released: March 20, 2019
At A Glance
- Radiomics analysis of data from CT images may help predict which non-small cell lung cancer patients will benefit from chemotherapy.
- Texture features from both within and around the lung tumor help predict chemotherapy response, time to progression and overall survival.
- The findings may also help identify those patients who are at elevated risk for disease recurrence and progression.
- RSNA Media Relations
1-630-590-7762
media@rsna.org - Linda Brooks
1-630-590-7738
lbrooks@rsna.org - Dionna Arnold
1-630-590-7791
darnold@rsna.org
OAK BROOK, Ill. (March 20, 2019)— Using data from computed tomography (CT) images, researchers may be able to predict which lung cancer patients will respond to chemotherapy, according to a new study published in the journal Radiology: Artificial Intelligence.
Platinum-based chemotherapy is typically the first-line treatment of advanced-stage non–small cell lung cancer (NSCLC). However, only about one in four patients responds well to this treatment. Currently, there is no way to predict which patients will benefit most from chemotherapy.
CT exams are routinely used for tumor staging and monitoring treatment response. Using a field of study called radiomics, researchers can extract quantitative, or measurable, data from CT images that can reveal disease characteristics not visible in the images alone.
“Our aim in this study was to determine whether an early prediction of response to chemotherapy is possible by using computer-extracted measurements of patterns both within and outside the lung nodule, along with the shape of the nodule, on baseline CT scans,” said Mohammadhadi Khorrami, M.S., a Ph.D. candidate from the Department of Biomedical Engineering, Case Western Reserve University School of Engineering in Cleveland, Ohio, who, along with Monica Khunger, M.D., from the Department of Internal Medicine at Cleveland Clinic, led the study.
The researchers set out to identify the role of radiomic texture features—both within and around the lung tumor—in predicting time to progression and overall survival, as well as response to chemotherapy in patients with NSCLC.
“This is the first study to demonstrate that computer-extracted patterns of heterogeneity, or diversity, from outside the tumor were predictive of response to chemotherapy,” Dr. Khunger said. “This is very critical because it could allow for predicting in advance of therapy which patients with lung cancer are likely to respond or not. This, in turn, could help identify patients who are likely to not respond to chemotherapy for alternative therapies such as radiation or immunotherapy.”
They analyzed data from 125 patients who had been treated with pemetrexed-based platinum doublet chemotherapy at Cleveland Clinic. The patients were divided randomly into two sets with an equal number of responders and non-responders in the training set. The training set comprised 53 patients with NSCLC, and the validation set comprised 72 patients.
A computer analyzed the CT images of lung cancer to identify unique patterns of heterogeneity both inside and outside the tumor. These patterns were then compared between CT scans of patients who did and did not respond to chemotherapy. These feature patterns were then used to train a machine learning classifier to identify the likelihood that a lung cancer patient would respond to chemotherapy.
“When we looked at patterns inside the tumor, we got an accuracy of 0.68. But when we looked inside and outside, the accuracy went up to 0.77,” Khorrami said.
The results showed that the radiomic features derived from within the tumor and the area around the tumor were able to distinguish patients who responded to chemotherapy from those who did not. In addition, the radiomic features predicted time to progression and overall survival.
“Despite the large number of studies in the CT-radiomics space, the immediate surrounding tumor area, or the peritumoral region, has remained relatively unexplored,” Khorrami said. “Our results showed clear evidence of the role of peritumoral texture patterns in predicting response and time to progression after chemotherapy.”
Although the researchers did not explicitly study the basis for the identified radiomic features around the tumor, they hypothesize that these patterns reflect increased fibrotic content in chemotherapy-compliant tumors.
According to Khorrami, the radiomic data derived from CT images can also potentially help identify those patients who are at elevated risk for recurrence and who might benefit from more intensive observation and follow-up.
“Combination of Peri- and Intratumoral Radiomic Features on Baseline CT Scans Predicts Response to Chemotherapy in Lung Adenocarcinoma.” Collaborating with Drs. Khorrami and Khunger were Alexia Zagouras, M.D., Pradnya Patil, M.D., Rajat Thawani, M.D., Kaustav Bera, M.D., Prabhakar Rajiah, M.D., Pingfu Fu, Ph.D., Vamsidhar Velcheti, M.D., and Anant Madabhushi, Ph.D.
Radiology: Artificial Intelligence is edited by Charles E. Kahn Jr., M.D., University of Pennsylvania (Penn) Perelman School of Medicine, Philadelphia, and owned and published by the Radiological Society of North America, Inc. (https://pubs.rsna.org/journal/ai )
RSNA is an association of over 53,400 radiologists, radiation oncologists, medical physicists and related scientists, promoting excellence in patient care and health care delivery through education, research and technologic innovation. The Society is based in Oak Brook, Ill. (RSNA.org)
For patient-friendly information on on lung cancer, visit RadiologyInfo.org.
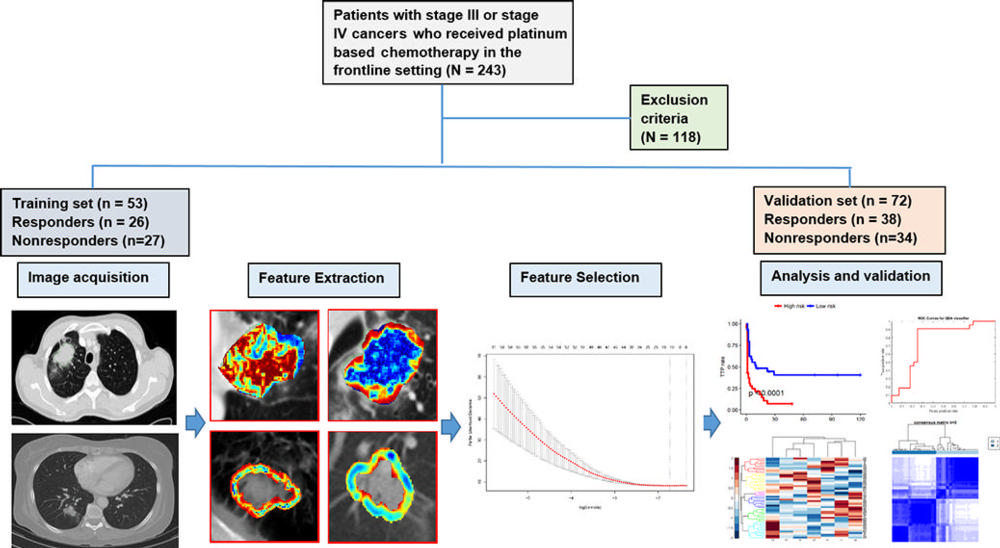
Figure 1. Flowchart shows strategy for patient selection and overall experimental design for this study.
High-res (TIF) version
(Right-click and Save As)
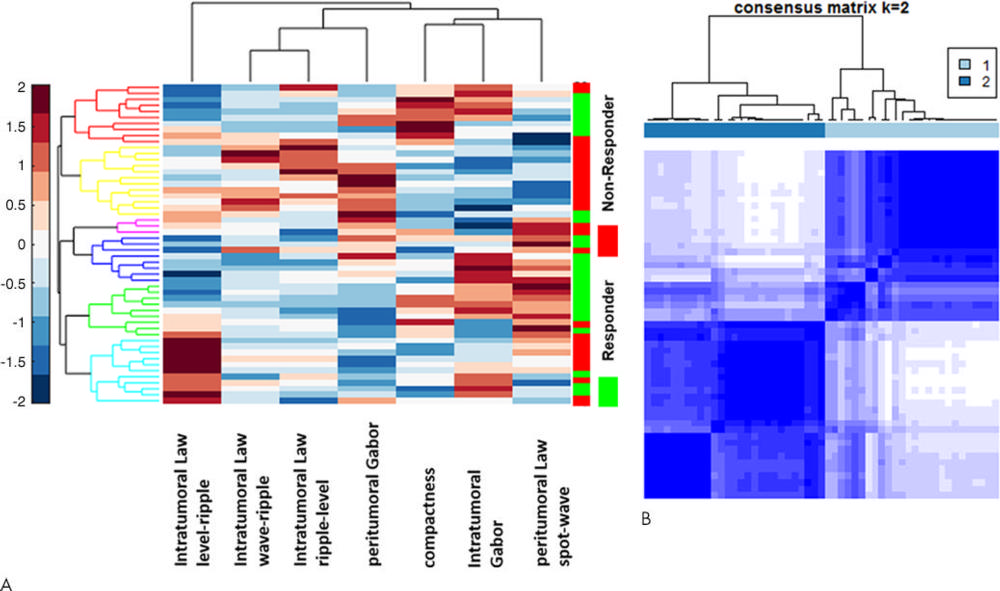
Figure 2. A, Heat map and dendrogram of the top seven discriminating features for responders and nonresponders in the training set. X axis = features selected by the feature selection method. Y axis = the training set of patients (n = 53). Colors represent feature values normalized between [0, 1]. A number of identified features showed significant differential expression between the responders and nonresponders for the patients in the training set. B, Matrix shows consensus clustering achieved through a combination of the top seven selected features. A total of 77 percent of the patients in cluster 1 were responders, and 23 percent were nonresponders. On the other hand, 78 percent of the patients in cluster 2 were nonresponders, with 22 percent of the patients being responders.
High-res (TIF) version
(Right-click and Save As)
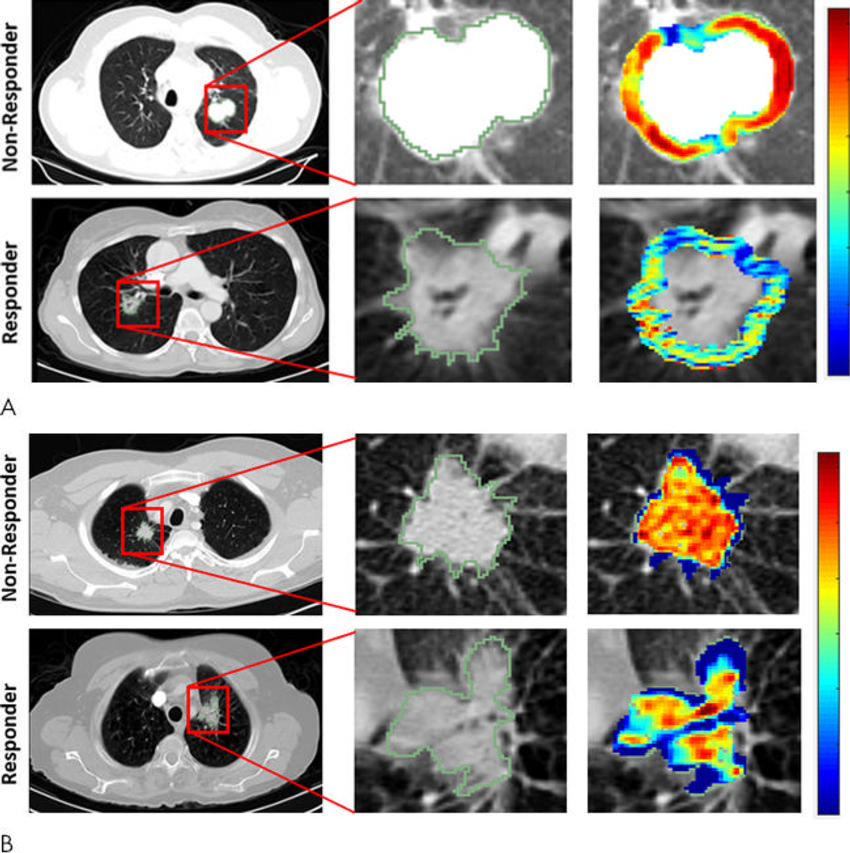
Figure 3. Radiomic feature maps show differences between lesions in responders and lesions in nonresponders at pretreatment CT. There appears to be overexpression of radiomic features (A, peritumoral Gabor and, B, intratumoral Laws features) in the nonresponder lesion compared with the responder lesion. The distribution of the features shows significant differences between the two lesion categories; these differences are captured by the skewness and kurtosis statistics of the feature distribution.
High-res (TIF) version
(Right-click and Save As)
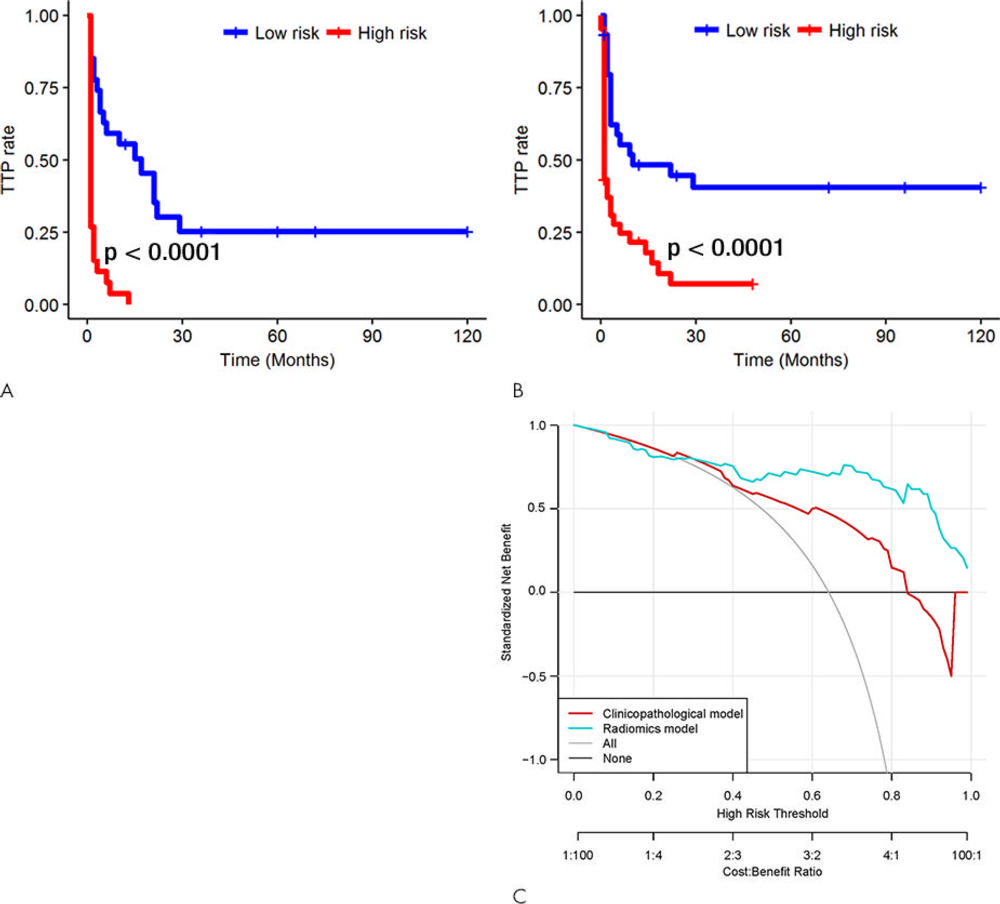
Figure 4. Kaplan-Meier survival analyses according to the radiomics signature risk-score for patients in, A, the training dataset and, B, the test set. A significant association of the radiomics signature with the time-to-progression (TTP) rate was shown in the training dataset (P < .0001), which was then confirmed in the validation dataset (P < .0001). C, Decision curve analysis for each model. The radiomics model had the highest net benefit in predicting which high-risk patients should receive treatment, as compared with a clinicopathologic model and simple strategies such as follow-up of all patients or no patients. This analysis was performed across the full range of threshold probabilities at which a patient would be selected to undergo follow-up imaging.
High-res (TIF) version
(Right-click and Save As)
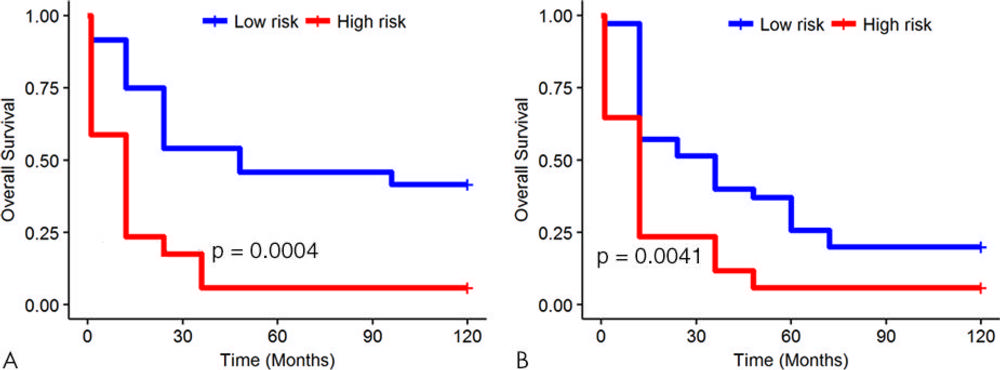
Figure 5. Kaplan-Meier survival analyses according to the radiomics signature for patients in, A, the training dataset and, B, the validation dataset. A significant association of the radiomics signature with overall survival was observed in the training dataset (P = .0004) and was then confirmed in the validation dataset (P = .0041).
High-res (TIF) version
(Right-click and Save As)
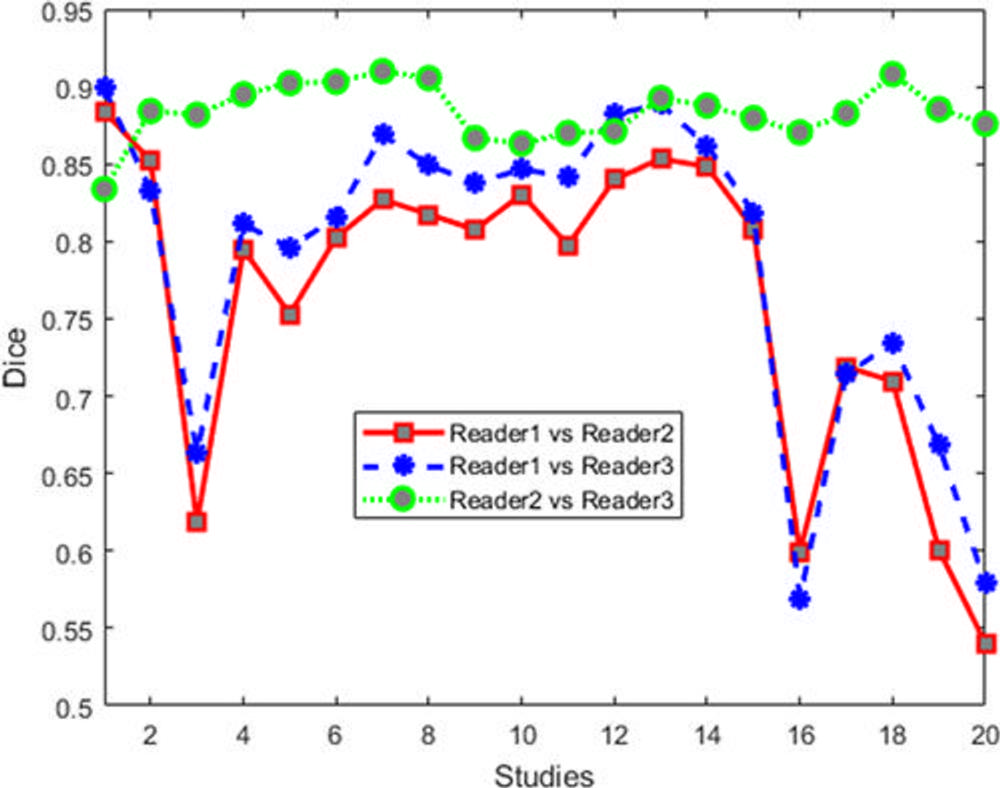
Figure 6. Dice values for human readers for 20 cases. Note that segmentation agreement values between each set of two readers are averaged from those sections identified as containing a lesion by the two readers.
High-res (TIF) version
(Right-click and Save As)