Breast Density Assessment Varies Greatly by Screening Method and Race
Released: March 19, 2019
At A Glance
- Breast density assessment varies greatly among woman depending on screening method and race.
- Data on 24,736 women who underwent mammography screening between 2010 and 2017 were analyzed.
- Changes in breast density assessments were more prominent among African-American women and women with higher BMI.
- RSNA Media Relations
1-630-590-7762
media@rsna.org - Linda Brooks
1-630-590-7738
lbrooks@rsna.org - Dionna Arnold
1-630-590-7791
darnold@rsna.org
OAK BROOK, Ill. — Fewer women are assigned to a dense breast category when evaluated with advanced mammographic screening technologies compared to standard digital mammography, according to a new study published in the journal Radiology.
A woman’s breast density, or the relative amount of glandular and connective tissue compared to fatty tissue, is assessed during a breast cancer screening with mammography. Women with the highest level of breast density have an increased risk for breast cancer and are advised to discuss supplemental screening with their physician. Most states in the U.S. have passed legislation mandating that women be notified of their breast density, and a federal law was just recently passed requiring the Food and Drug Administration (FDA) to oversee such notification.

Although digital mammography (DM) has long been the foundation of breast cancer screening, new imaging methods, or modalities, are increasingly being used, including digital breast tomosynthesis (DBT), also known as 3-D mammography, and synthetic mammography (SM).
In DM, two X-ray images are taken of the breast from top-to-bottom and from side-to-side while the breast is compressed against an imaging detector. In DBT, an X-ray tube moves in an arc over the compressed breast capturing multiple images from different angles. The DBT data can then be reconstructed into a quasi-3-D image stack that allows better lesion characterization and localization.
In 2011, the FDA approved the use of DBT in combination with DM imaging. In 2015, the FDA approved the use of synthesized 2-D images, which are reconstructed from the DBT data set to replace DM imaging, lowering the dose of DBT imaging.
In this retrospective study, researchers analyzed data from 24,736 women who underwent mammography screening at the Hospital of the University of Pennsylvania (HUP) between 2010 and 2017. Data collected included the breast density category assigned at the time of the screening using the standardized BI-RADS system, race, age and body mass index (BMI). The study population was 46 percent white and 54 percent African-American (mean age 56.3 years).
“Major strengths of our study were the size of our sample and the diverse patient population, which was approximately half white and half African-American,” said Aimilia Gastounioti, Ph.D., lead author and research associate in the Radiology Department at HUP’s Perelman School of Medicine.
Of the 60,766 imaging exams included in the study, 8,935 were conducted with DM (14.7 percent), 30,799 (50.7 percent) were performed with DM/DBT, and 21,052 (34.6 percent) used SM/DBT.
A statistical analysis of the study data showed breast density assignments varied greatly by the screening method used.
“We observed an overall trend of downgraded breast density when imaging was performed with either DM/DBT or SM/DBT compared with DM alone,” Dr. Gastounioti said. “These effects were more prominent among African-American women and women with higher BMI.”
Compared to standard DM imaging, the odds of a high-density assessment were reduced by 31 percent and 57 percent respectively when mammographic imaging was performed with DM/DBT or SM/DBT. The odds of receiving a high breast density assignment after SM replaced DM were reduced by 38 percent.
The density downgrade may be due to the perception of less fibroglandular tissue in the 3-D display of DBT imaging compared to DM’s flat, 2-D display, as well as differences in the appearance of the denser glandular tissue and the fatty tissue in the reconstructed SM imaging.
“Our findings may have direct implications for personalized screening since breast density assignments, which often drive recommendations for supplemental screening, may vary greatly by modality, race and BMI,” Dr. Gastounioti said.
She added that further research is needed to determine whether BI-RADS guidelines need to be adjusted for new imaging modalities.
“Effect of Mammographic Screening Modality on Breast Density Assessment: Digital Mammography versus Digital Breast Tomosynthesis.” Collaborating with Dr. Gastounioti were Anne Marie McCarthy, Ph.D., Lauren Pantalone, B.S., Marie Synnestvedt, Ph.D., Despina Kontos, Ph.D., and Emily F. Conant, M.D.
The study was supported by the Susan G. Komen for the Cure Breast Cancer Foundation and the National Cancer Institute at the National Institutes of Health.
Radiology is edited by David A. Bluemke, M.D., Ph.D., University of Wisconsin School of Medicine and Public Health, Madison, Wis., and owned and published by the Radiological Society of North America, Inc. (https://pubs.rsna.org/journal/radiology)
RSNA is an association of over 53,400 radiologists, radiation oncologists, medical physicists and related scientists promoting excellence in patient care and health care delivery through education, research and technologic innovation. The Society is based in Oak Brook, Ill. (RSNA.org)
For patient-friendly information on breast imaging visit RadiologyInfo.org
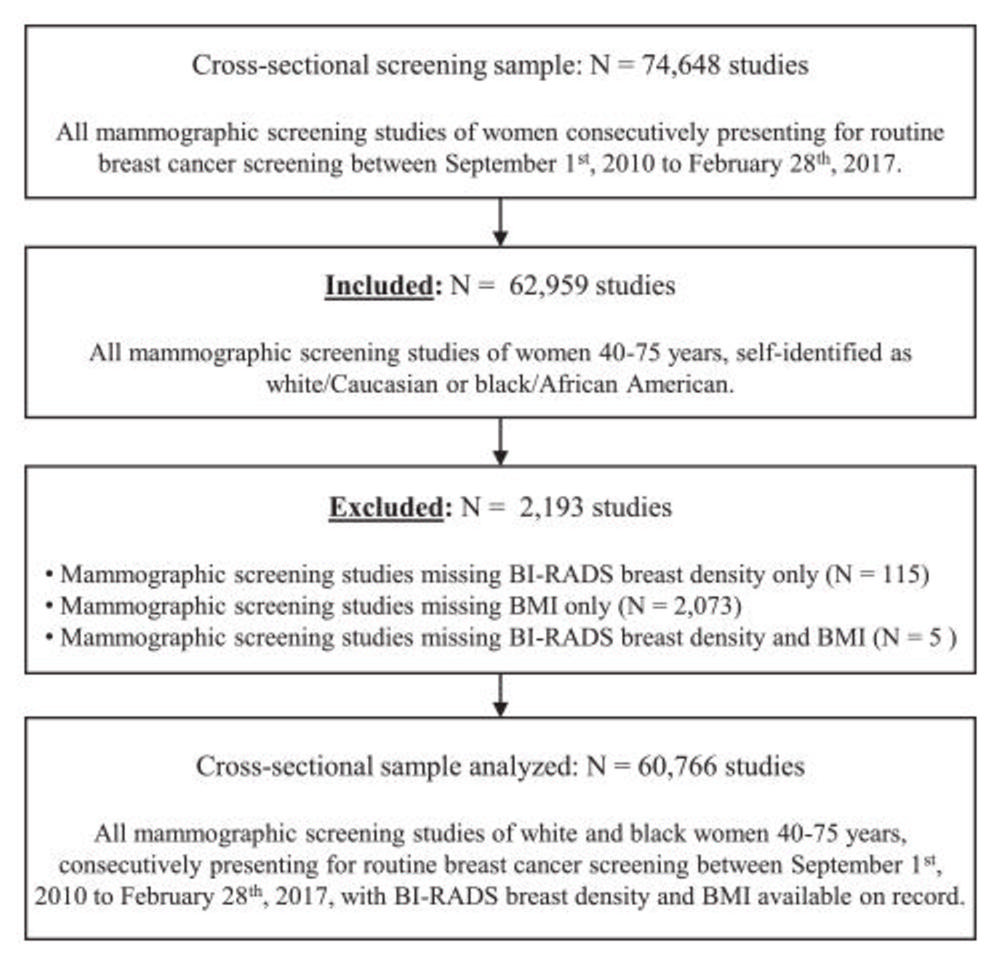
Figure 1. Flowchart shows inclusion and exclusion criteria for cross-sectional screening sample analyzed in the study. BI-RADS = Breast Imaging Reporting and Data System, BMI = body mass index.
High-res (TIF) version
(Right-click and Save As)
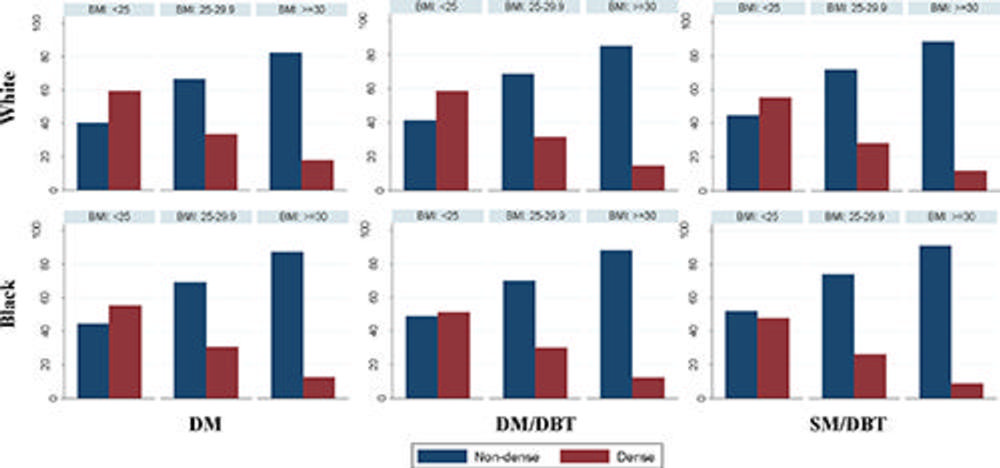
Figure 2. Histograms of Breast Imaging Reporting and Data System density categorization across different body mass index groups according to screening mammographic modality and ethnicity (black women and white women). BMI = body mass index, DBT = digital breast tomosynthesis, DM = digital mammography, SM = synthetic mammography.
High-res (TIF) version
(Right-click and Save As)
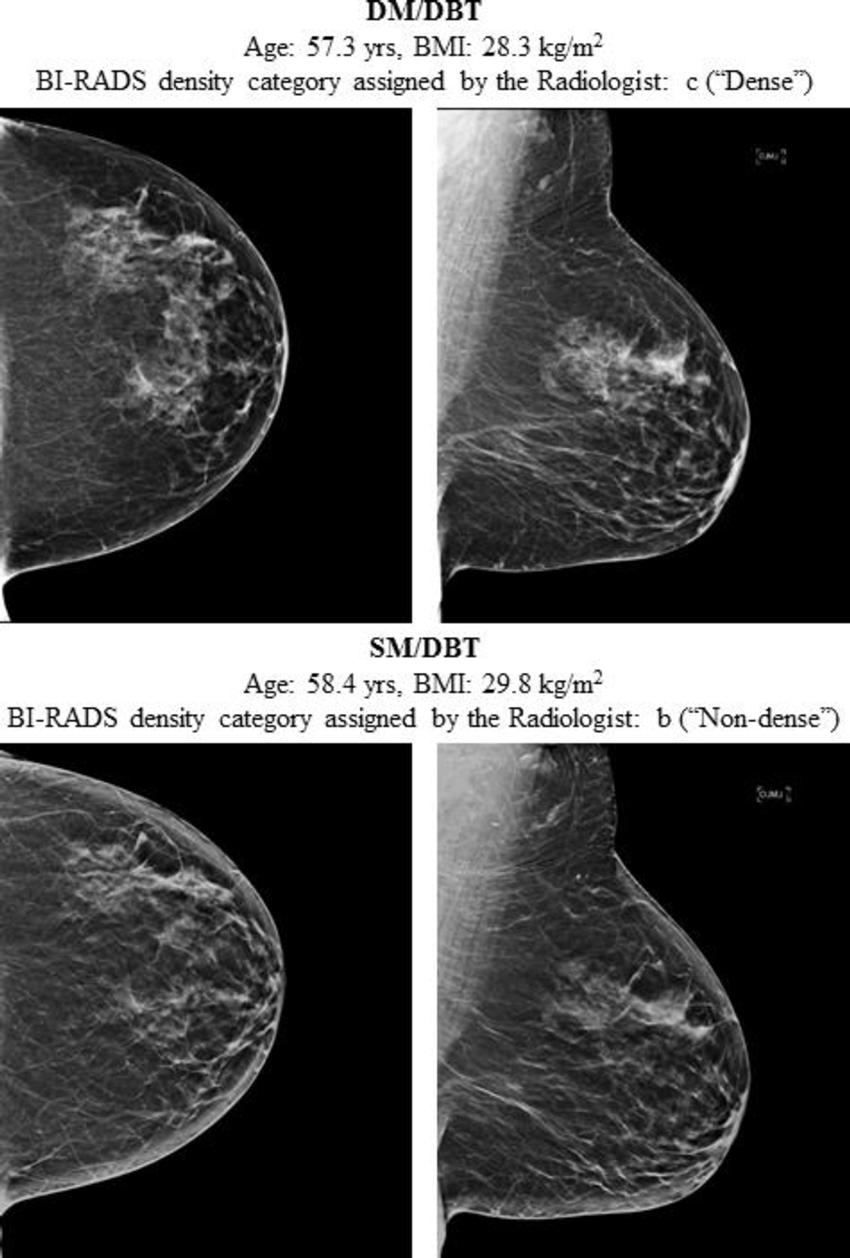
Figure 3. Craniocaudal (left) and mediolateral-oblique (right) consecutive digital mammography (DM) digital breast tomosynthesis (DBT) images (top) and, 1.1 years later, the synthetic mammography (SM) and DBT screening images (bottom) of the same postmenopausal white woman interpreted by the same radiologist. The DM and DBT screening examination was assigned Breast Imaging Reporting and Data System (BI-RADS) density category c (ie, dense), whereas the synthetic mammography and DBT screening examination was assigned BI-RADS density category b (ie, nondense). BMI = body mass index.
High-res (TIF) version
(Right-click and Save As)
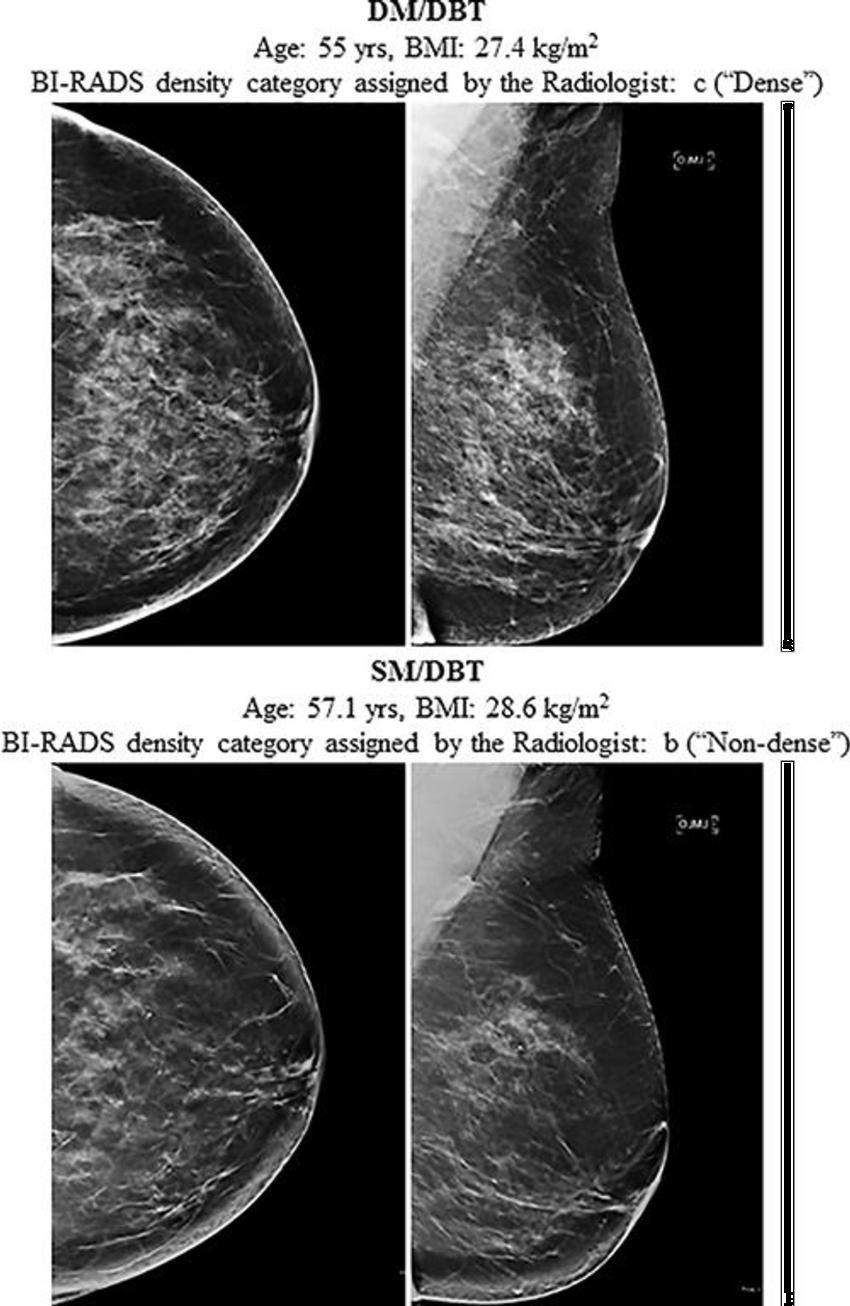
Figure 4. Craniocaudal (left) and mediolateral-oblique (right) images from consecutive digital mammography (DM) and digital breast tomosynthesis (DBT) images (top) and 2.1 years later the synthetic mammography (SM) and DBT screening images (bottom) of the same postmenopausal black woman interpreted by the same radiologist. The digital mammography and DBT screening examination (top) was assigned Breast Imaging Reporting and Data System (BI-RADS) density category c (ie, dense), whereas the synthetic mammography and DBT screening examination was assigned BI-RADS density category b (ie, nondense). BMI = body mass index.
High-res (TIF) version
(Right-click and Save As)