Abdominal Aortic Calcification May Signal Future Heart Attack
Released: October 02, 2018
At A Glance
- Researchers assessed the relationship between abdominal aortic calcification on CT and cardiovascular events in 829 asymptomatic patients.
- Researchers found a strong association between abdominal aortic calcification and future cardiovascular events.
- Abdominal aortic calcification was more than five times higher in patients who had a cardiovascular event than in those who didn’t.
- RSNA Media Relations
1-630-590-7762
media@rsna.org - Linda Brooks
1-630-590-7738
lbrooks@rsna.org - Dionna Arnold
1-630-590-7791
darnold@rsna.org
OAK BROOK, Ill. —Computed tomography (CT)-based measures of calcification in the abdominal aorta are strong predictors of heart attacks and other adverse cardiovascular events—stronger even than the widely used Framingham risk score, according to a new study published in the journal Radiology
Cardiovascular diseases are the leading cause of death worldwide. Of these deaths, heart disease and stroke are the deadliest. Effective measures of cardiovascular disease risk are crucial in predicting which patients are most in need of early interventions like diet and lifestyle changes, or medications to lower cholesterol.
“We found a strong association between abdominal aortic calcification and future cardiovascular events,” said lead author Stacy D. O’Connor, M.D., M.P.H., assistant professor of radiology at the Medical College of Wisconsin in Milwaukee. “With heart disease being a leading cause of death, anything we can do to make our patients more aware of their risk is going to help.”

The Framingham risk score is a well-known and widely used prediction model for cardiovascular disease based on traditional risk factors like age, cholesterol and blood pressure. However, many patients evaluated by the Framingham risk score fall into an indeterminate risk category and could benefit from additional noninvasive tools for refining risk assessment like measures of atherosclerosis, which is narrowing of the arteries due to plaque buildup. CT is commonly used to measure calcium, a component of plaque, in the coronary arteries.
CT can also measure calcium in the abdominal aorta, the large vessel that carries oxygenated blood to the lower extremities. The abdominal aorta can be seen on abdominal imaging exams like CT colonography, also known as virtual colonoscopy, and in the diagnostic workup for acute cholecystitis, an inflammation of the gallbladder often caused by gallstones.
For the new study, conducted at the University of Wisconsin School of Medicine and Public Health in Madison, researchers assessed the relationship between abdominal aortic calcification on CT and cardiovascular events in 829 asymptomatic patients with a mean age of approximately 58 years. The patients had undergone nonenhanced screening CT colonography between April 2004 and March 2005. The researchers were able to follow the patients for an average of 11 years to see if they had developed adverse cardiovascular events like heart attack, stroke, death or congestive heart failure.
Of the 829 patients, 156 (18.8 percent) had a major cardiovascular event. The events occurred almost seven years after CT, on average, and included heart attack in 39 and death in 79. CT-based abdominal aortic calcification was a strong predictor of future cardiovascular events, outperforming the Framingham risk score. Abdominal aortic calcification was more than five times higher, on average, among those who had a cardiovascular event than those who didn’t.
The results point to the potential of abdominal aortic calcification assessment as an opportunistic screening tool—something that could be added to other exams without the need for additional patient time or radiation dose. Patients could be assigned to preventive treatment regimens based on their cardiovascular risk categories.
“There are thousands of CT scans performed every day across the United States, so this gives us an opportunity to reach a lot of people,” Dr. O’Connor said. “For instance, if someone is getting a scan for cholecystitis and we see abdominal aortic calcification on the CT, we can address things like blood pressure and cholesterol with the patient.”
The researchers plan to build on their results by studying larger groups of patients. They also intend to move toward a fully-automated protocol for more widespread implementation of the assessment.
“It’s our hope that these opportunistic measures can be added to reports for patients undergoing routine abdominal CT, regardless of the imaging indication,” Dr. O’Connor said.“Does Nonenhanced CT-based Quantification of Abdominal Aortic Calcification Outperform the Framingham Risk Score in Predicting Cardiovascular Events in Asymptomatic Adults?” Collaborating with Dr. O’Connor were Peter M. Graffy, M.P.H., Ryan Zea, M.S., and Perry J. Pickhardt, M.D.
Radiology is edited by David A. Bluemke, M.D., Ph.D., University of Wisconsin School of Medicine and Public Health, Madison, Wis., and owned and published by the Radiological Society of North America, Inc. (http://radiology.rsna.org/)
RSNA is an association of over 54,200 radiologists, radiation oncologists, medical physicists and related scientists, promoting excellence in patient care and health care delivery through education, research and technologic innovation. The Society is based in Oak Brook, Ill. (RSNA.org)
For patient-friendly information on abdominal CTRadiologyInfo.org.
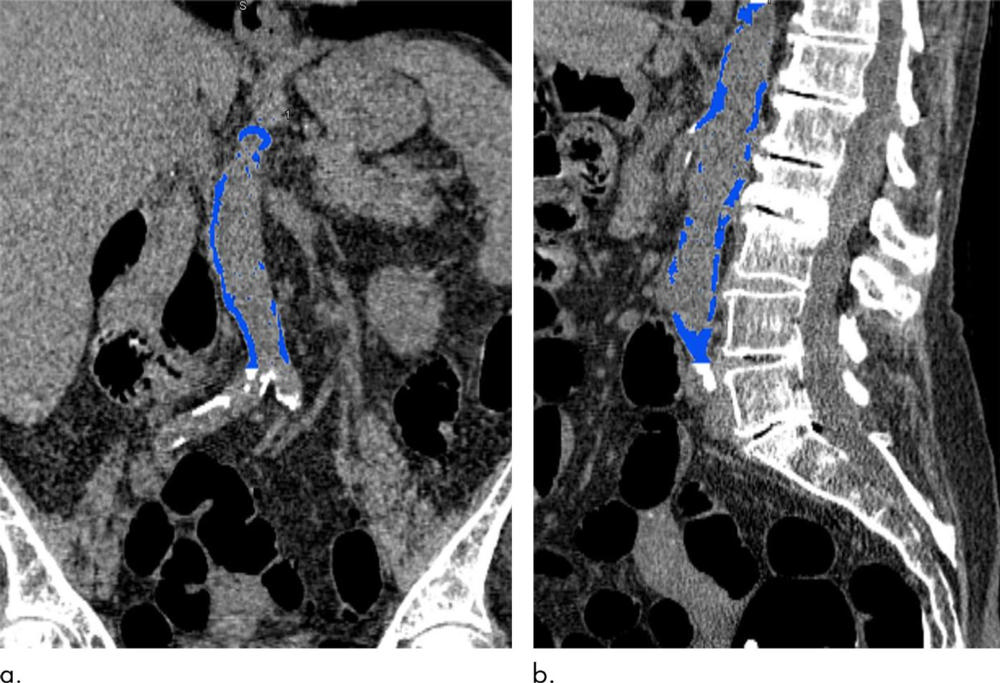
Figure 1. Images from CT colonography show segmented abdominal aortic calcification measured with semiautomated CT tool on (a) coronal and (b) sagittal images. Within region of interest over aorta selected by user, tool automatically segments and quantifies aortic calcification (shown in blue).
High-res (TIF) version
(Right-click and Save As)
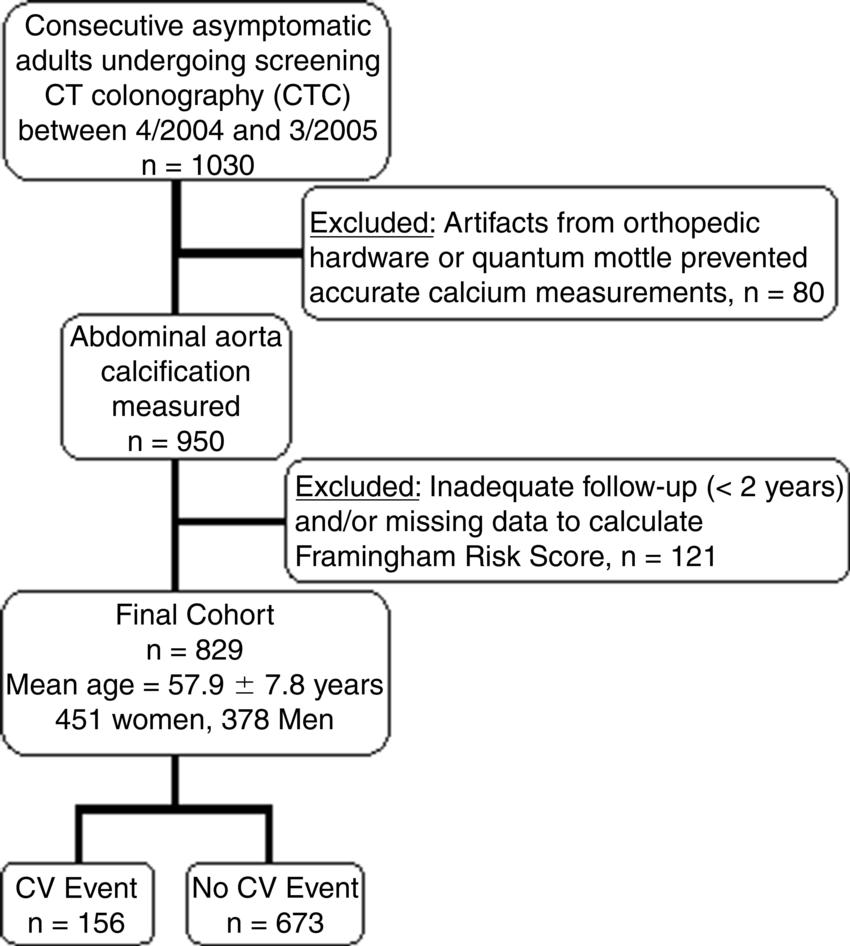
Figure 2. Flowchart shows cohort selection process. CV = cardiovascular.
High-res (TIF) version
(Right-click and Save As)
Figure 3. Kaplan-Meier plots show time to cardiovascular event for abdominal aortic calcification (AAC) and Framingham risk score (FRS) according to quartiles. (a) CT-based AAC values by quartile. (b) FRS values by quartile. Spread of quartile groups for AAC is improved compared with FRS. First quartile for FRS intersects with second and third quartiles beyond 50 months of follow-up.
High-res (TIF) version
(Right-click and Save As)
Figure 4. Graphs show superimposed receiver operating characteristic (ROC) curves for abdominal aortic calcification (AAC) alone, Framingham risk score (FRS) alone, and both AAC and FRS combined for cardiovascular events occurring within (a) 2 years, (b) 5 years, and (c) 10 years from the time of CT. Performance of CT-based AAC score is improved over FRS. In addition, combining AAC and FRS did not improve performance of AAC alone.
High-res (TIF) version
(Right-click and Save As)