Abnormal Brain Connections Seen in Preschoolers with Autism
Released: March 27, 2018
At A Glance
- Brain network connectivity is altered in young children with autism spectrum disorder.
- Early diagnosis and intervention are important in autism spectrum disorder.
- Children with autism spectrum disorder demonstrated significant differences in components of the basal ganglia network, a brain system that plays a crucial role in behavior.
- RSNA Media Relations
1-630-590-7762
media@rsna.org - Linda Brooks
1-630-590-7738
lbrooks@rsna.org - Dionna Arnold
1-630-590-7791
darnold@rsna.org
OAK BROOK, Ill. — Preschoolers with autism spectrum disorder, or ASD, have abnormal connections between certain networks of their brains that can be seen using a special MRI technique, according to a study published online in the journal Radiology. Researchers said the findings may one day help guide treatments for ASD.

ASD refers to a group of developmental disorders characterized by communication difficulties, repetitive behaviors and limited interests or activities. Young children with ASD can usually be diagnosed within the first few years of life. Early diagnosis and intervention are important because younger patients typically benefit most from treatments and services to improve their symptoms and ability to function.
While developments in brain imaging have enabled the discovery of abnormal brain connectivity in younger children with ASD, the phenomenon has not yet been fully investigated at the brain network level. Brain networks are areas of the brain connected by white matter tracts that interact to perform different functions.
For the new study, researchers looked for differences in brain connectivity in children with ASD using an MRI technique called diffusion tensor imaging (DTI). The technique provides important information on the state of the brain's white matter.
Researchers compared DTI results between 21 preschool boys and girls with ASD (mean age of 4-and-a-half years old) with those of 21 similarly aged children with typical development. They applied graph theory to the DTI results to understand more about the level of connectivity between brain networks. By applying graph analysis to the DTI results, researchers can measure the relationships among highly connected and complex data like the network of connections that forms the human brain.
Compared with the typically developed group, children with ASD demonstrated significant differences in components of the basal ganglia network, a brain system that plays a crucial role in behavior. Differences were also found in the paralimbic-limbic network, another important system in regulating behavior.
"Altered brain connectivity may be a key pathophysiological feature of ASD," said study co-author Lin Ma, M.D., from the Department of Radiology at Chinese PLA General Hospital in Beijing. "This altered connectivity is visualized in our findings, thus providing a further step in understanding ASD."
The results suggest that these altered patterns may underlie the abnormal brain development in preschool children with ASD and contribute to the brain and nervous system mechanisms involved in the disorder. In addition, the identification of altered structural connectivity in these networks may point toward potential imaging biomarkers for preschool children with ASD.
"The imaging finding of those 'targets' may be a clue for future diagnosis and even for therapeutic intervention in preschool children with ASD," Dr. Ma said.
For instance, Dr. Ma said, in the future this type of brain imaging might aid in the delivery of ASD therapies for children like repetitive transcranial magnetic stimulation, or TMS, and transcranial direct current stimulation, or tDCS. TMS involves using a magnet to target and stimulate certain areas of the brain, while tDCS relies on electrical currents to deliver therapy. Both are being investigated as possible treatments for ASD.
"Alterations of White Matter Connectivity in Preschool Children with Autism Spectrum Disorder." Collaborating with Dr. Ma were Shi-Jun Li, M.D., Ph.D., Yi Wang, M.D., Long Qian, M.Sc., Gang Liu, M.D., Shuang-Feng Liu, M.S., Li-Ping Zou, M.D., Ji-Shui Zhang, M.S., Nan Hu, M.S., Xiao-Qiao Chen, M.S., Sheng-Yuan Yu, M.D., Sheng-Li Guo, M.D., Ke Li, M.D., Mian-Wang He, M.S., Hai-Tao Wu, Ph.D., Jiang-Xia Qiu, Ph.D., Lei Zhang, B.S., Yu-Lin Wang, M.D., and Xin Lou, M.D.
Radiology is edited by David A. Bluemke, M.D., Ph.D., University of Wisconsin School of Medicine and Public Health, Madison, Wis., and owned and published by the Radiological Society of North America, Inc. (http://radiology.rsna.org/)
RSNA is an association of over 54,200 radiologists, radiation oncologists, medical physicists and related scientists, promoting excellence in patient care and health care delivery through education, research and technologic innovation. The Society is based in Oak Brook, Ill. (RSNA.org)
For patient-friendly information on brain imaging, visit RadiologyInfo.org.
Images (.JPG and .TIF format)
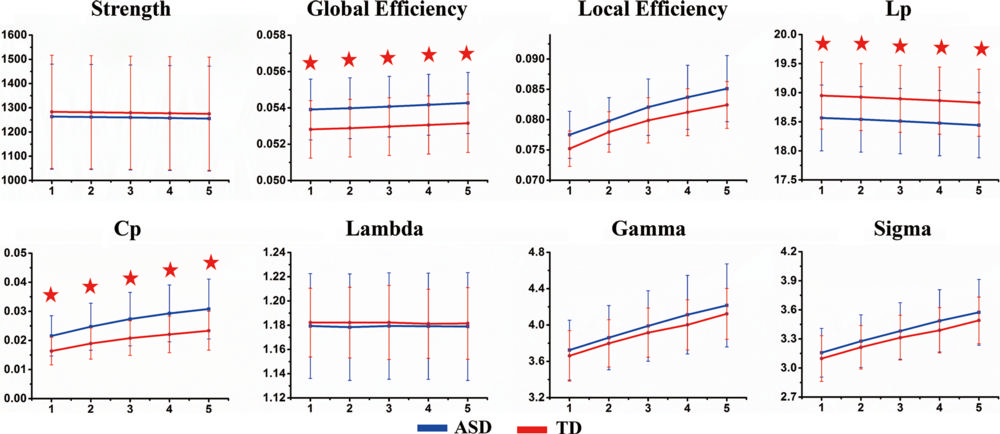
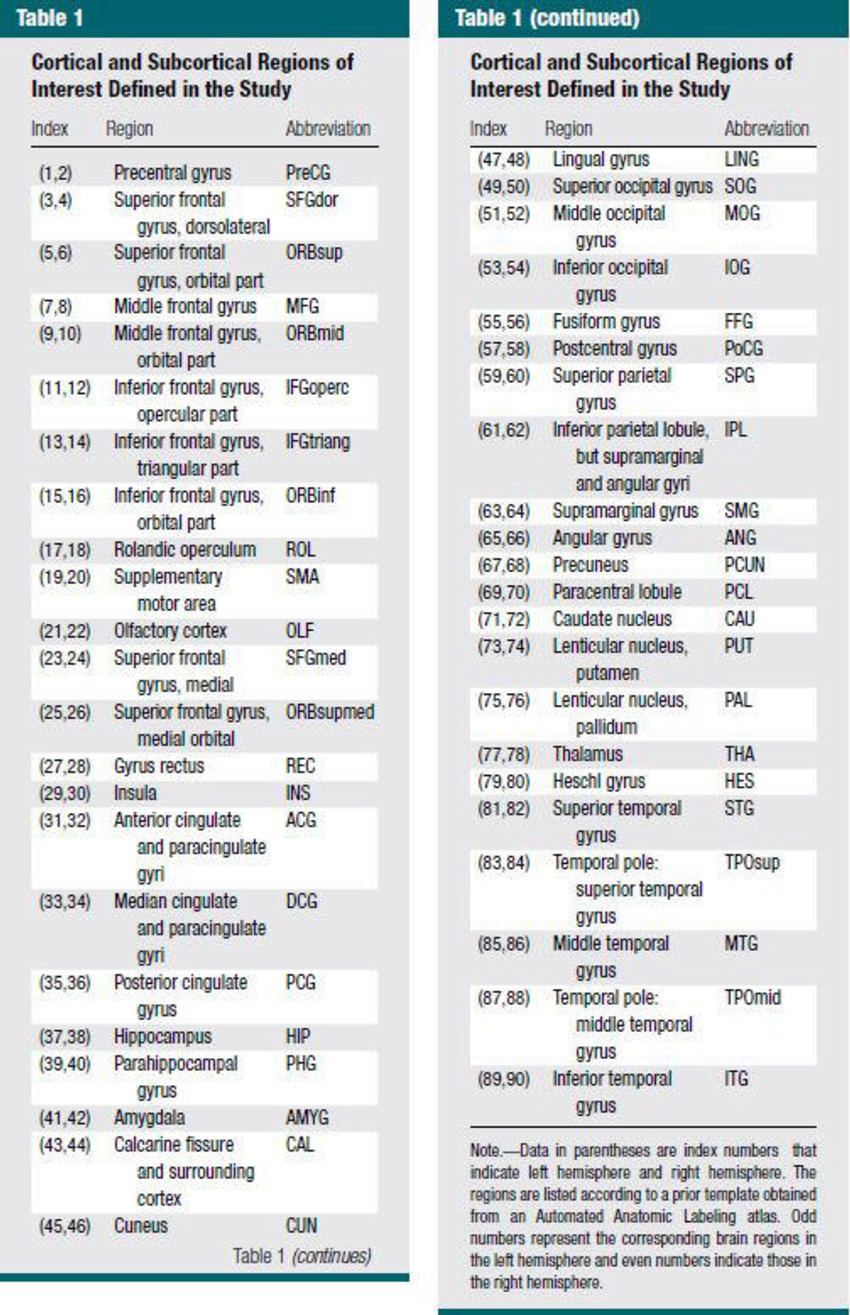
Figure 1. Global measurements of white matter connectivity networks in typical development (TD) and autism spectrum disorder (ASD) groups. The threshold T (x-axis) determined the minimum streamlines required to interconnect a pair of nodes for a connection to be assumed. T = n (1, 2, 3, 4, 5) indicates that the minimum number of streamlines required for a link to be drawn. Significant between-group differences (red star) were found for global efficiency, characteristic path length (Lp), and clustering coefficients (Cp), and for all thresholds.
High-res (TIF) version
(Right-click and Save As)
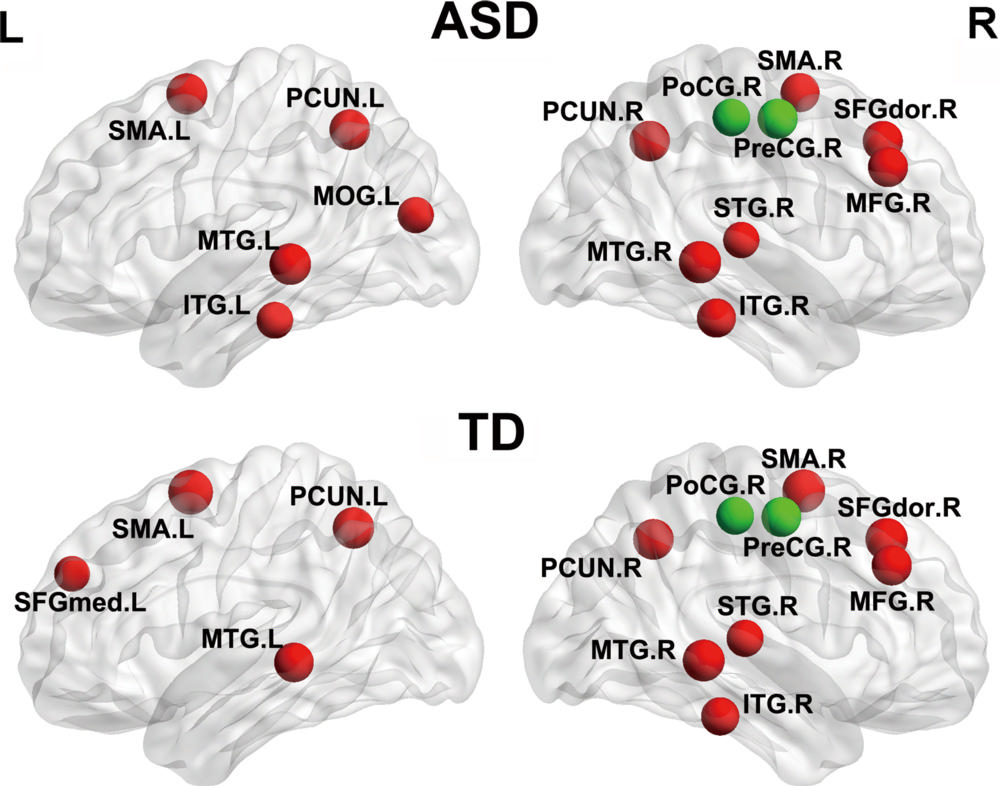
Figure 2. The distribution of hub regions in typical development (TD) and autism spectrum disorder (ASD) groups. Hub regions were defined as nodes with regional efficiencies at least one standard deviation higher than the average for the network by using three-dimensional rendering maps. These areas included association (red) and primary (green) regions. L = left; R = right. See Table 1 for region abbreviations.
High-res (TIF) version
(Right-click and Save As)
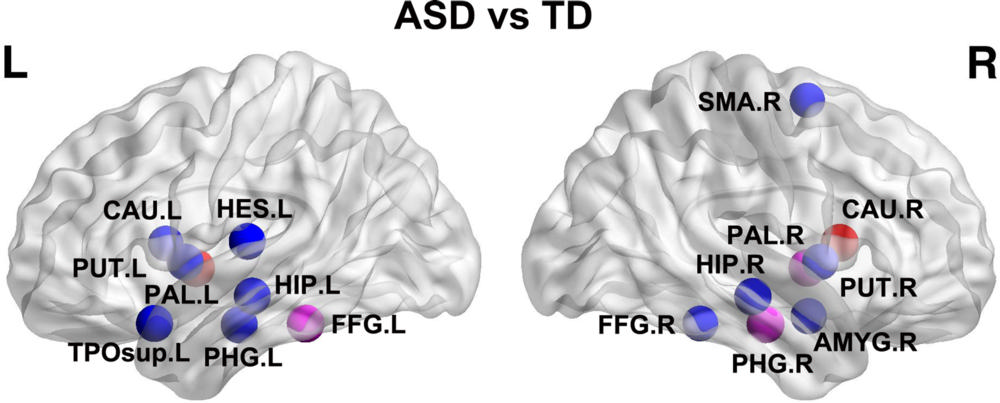
Figure 3. Brain regions with significant between-group differences in nodal efficiency. Nodes represent brain regions with significant intergroup differences in the regional efficiencies (corrected and uncorrected). Brain regions are shown in red, purple, and blue and indicate nodal P values that are, respectively, P ˂ .05 (false discovery rate corrected), P ˂ .01 (uncorrected), and P ˂ .05 (uncorrected). ASD = autism-spectrum disorder; L = left; R = right; TD = typical development. See Table 1 for region abbreviations.
High-res (TIF) version
(Right-click and Save As)
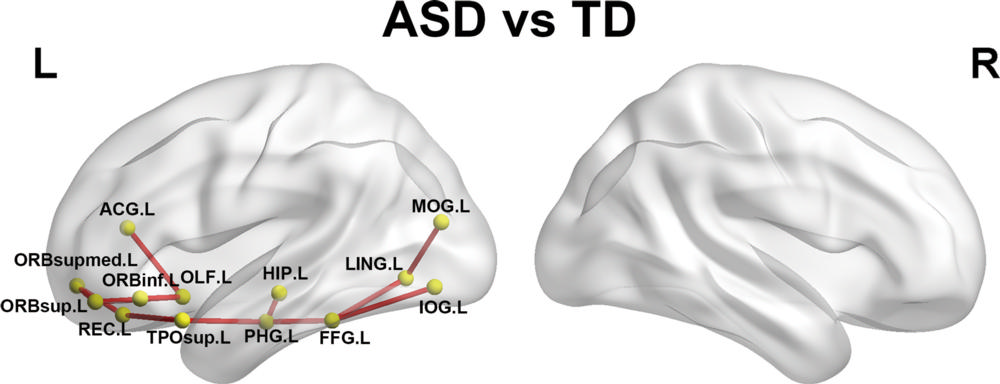
Figure 4. Networks showing increased structural connections in children with autism-spectrum disorder (ASD) compared with children with typical development (TD). The regional pairs showed increased connections in children with ASD compared with TD. These connections formed a single connected network with 13 nodes and 12 connections in the left (L) hemisphere. The fiber number–weighted white matter network for each participant was constructed by using the Automated Anatomic Labeling template. The nodes and connections were mapped onto the cortical surfaces by using the brain network visualization tool BrainNet viewer. R = right. See Table 1 for region abbreviations.
High-res (TIF) version
(Right-click and Save As)