MRI Reveals Striking Brain Differences in People with Genetic Autism
Released: August 08, 2017
At A Glance
- Researchers have identified structural abnormalities in the brains of people with one of the most common genetic causes of autism.
- The abnormalities seen on MRI corresponded to cognitive and behavioral impairments in the study group.
- Autism spectrum disorders affect more that 3.5 million people in the U.S.
- RSNA Media Relations
1-630-590-7762
media@rsna.org - Linda Brooks
1-630-590-7738
lbrooks@rsna.org

OAK BROOK, Ill. – In the first major study of its kind, researchers using MRI have identified structural abnormalities in the brains of people with one of the most common genetic causes of autism, according to a new study published online in the journal Radiology. The abnormalities visible on brain images corresponded to cognitive and behavioral impairments in the study group, suggesting a future role for imaging in identifying people with autism who are in most urgent need of intervention.
Autism spectrum disorders are a group of developmental problems, affecting more than 3.5 million people in the U.S., according to the Centers for Disease Control and Prevention. Symptoms typically appear early in life and frequently include communication problems and repetitive behaviors. Many people with autism have abnormalities at a specific site on the 16th chromosome known as 16p11.2. Deletion or duplication of a small piece of chromosome at this site is one of the most common genetic causes of autism spectrum disorder.
“People with deletions tend to have brain overgrowth, developmental delays and a higher risk of obesity,” said study author Julia P. Owen, Ph.D., a brain researcher at the University of Washington in Seattle, who was at the University of California in San Francisco (UCSF) during the study. “Those with duplications are born with smaller brains and tend to have lower body weight and developmental delays.”
The researchers at UCSF and four other sites performed structural MRI exams on 79 deletion carriers, ranging in age from 1 to 48, and 79 duplication carriers, ages 1 to 63, along with 64 unaffected family members and 109 participants in a control group.
The participants completed a battery of cognitive and behavioral tests, and neuroradiologists reviewed the brain images for development-related abnormalities. The results showed some striking differences in the brain structures of deletion and duplication carriers compared with non-carriers. For instance, the corpus callosum, the fiber bundle that connects the left and right sides of the brain, was abnormally shaped and thicker in the deletion carriers but thinner in the duplication carriers, compared to the control group and familial non-carriers.
Other stark differences were apparent. The deletion carriers displayed features of brain overgrowth, including the extension of the cerebellum, the bottom back part of the brain, toward the spinal cord.
The duplication carriers showed characteristics of brain undergrowth, such as decreased white matter volume and larger ventricles — the cavities in the brain filled with cerebrospinal fluid.
When the researchers compared cognitive assessments to imaging findings, they found that the presence of any imaging feature associated with the deletion carriers — such as a thicker corpus callosum — indicated worse daily living, communication and social skills, compared to deletion carriers without any radiological abnormalities. For the duplication carriers, the presence of decreased white matter and corpus callosal volume and increased ventricle size was associated with decreased full-scale and verbal IQ scores, compared to duplication carriers without those findings.
Key to the study’s strength was its access to a large, diverse group of 16p11.2 deletion and duplication carriers, according to senior author Elliott Sherr, M.D., Ph.D., head of the Brain Development Research Program at UCSF.
“Often studies like this focus on high-functioning individuals, but this was an ‘all-comers’ group,” he said. “We didn’t do mathematical algorithms but rather used the trained eyes of neuroradiologists to evaluate the scans of a full range of individuals. When you look at a broad range of people like this, from developmentally normal to more significantly challenged, you’re better able to find these correlations.”
“Brain MR Imaging Findings and Associated Outcomes in Carriers of the Reciprocal Copy Number Variation at 16p11.2.” Collaborating with Drs. Owen and Sherr were Polina Bukshpun, B.A., Nicholas Pojman, B.S., Tony Thieu, M.S., Qixuan Chen, Ph.D., Jihui Lee, M.S., Debra D’Angelo, M.S., Orit A. Glenn, M.D., Jill V. Hunter, M.D., Jeffrey I. Berman, Ph.D., Timothy P. Roberts, Ph.D., Randy Buckner, Ph.D., Srikantan S. Nagarajan, Ph.D., and Pratik Mukherjee, M.D., Ph.D.
The study was supported by the Simons Variation in Individuals Project, or Simons VIP (sponsored by the Simons Foundation).
Radiology is edited by Herbert Y. Kressel, M.D., Harvard Medical School, Boston, Mass., and owned and published by the Radiological Society of North America, Inc. (http://pubs.rsna.org/journal/radiology)
RSNA is an association of over 54,600 radiologists, radiation oncologists, medical physicists and related scientists promoting excellence in patient care and health care delivery through education, research and technologic innovation. The Society is based in Oak Brook, Ill. (RSNA.org)
For patient-friendly information on brain MRI, visit RadiologyInfo.org.
Images (.JPG and .TIF format)
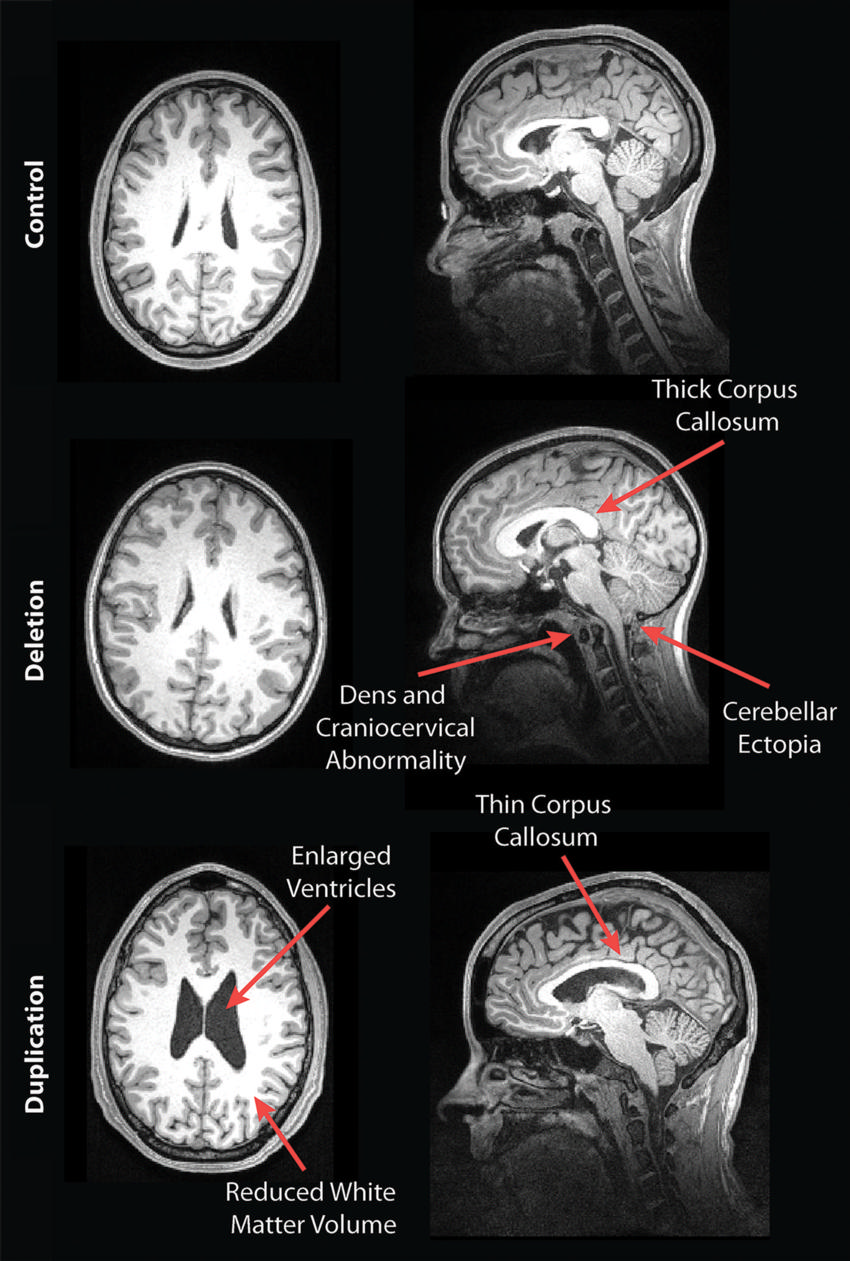
Figure 1. Example images for a control participant, a deletion carrier, and a duplication carrier. In the sagittal image of the deletion carrier, the thick corpus callosum, dens and craniocervical abnormality, and cerebellar ectopia are shown. For the duplication carrier, the sagittal image shows the thin corpus callosum and the axial image shows the increased ventricle size and decreased white matter volume.
High-res (TIF) version
(Right-click and Save As)
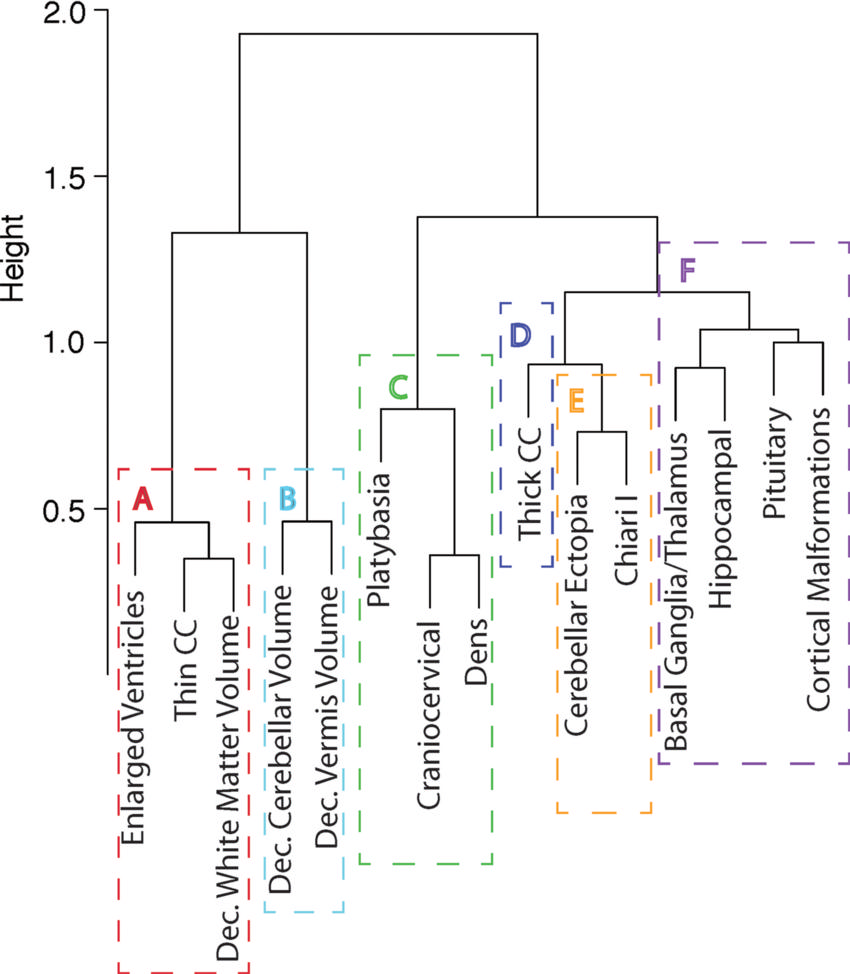
Figure 2. Dendrogram obtained from hierarchical clustering of the radiologic findings in the duplication and deletion carriers. A and B represent radiologic features of the duplication carriers; C, D, and E contain the features associated with the deletion carriers; and F is composed of the radiologic features that were relatively low in frequency in both groups and not more strongly associated with deletion or duplication carriers. CC = corpus callosum; Dec. = decreased.
High-res (TIF) version
(Right-click and Save As)