Researchers Identify Visual System Changes that May Signal Parkinson's Disease
Released: July 11, 2017
At A Glance
- Changes in visual system may be an early indicator of Parkinson’s disease.
- Visual alterations include the inability to perceive colors, a change in visual acuity and a decrease in blinking.
- Visual symptoms may appear more than 10 years before motor symptoms.
- RSNA Media Relations
1-630-590-7762
media@rsna.org - Linda Brooks
1-630-590-7738
lbrooks@rsna.org
OAK BROOK, Ill. — Changes in the visual systems of newly diagnosed Parkinson’s disease patients may provide important biomarkers for the early detection and monitoring of the disease, according to a new study published online in the journal Radiology.
“Just as the eye is a window into the body, the visual system is a window into brain disorders,” said lead researcher Alessandro Arrigo, M.D., a resident in ophthalmology at the University Vita-Salute San Raffaele of Milan, Italy.
Parkinson’s disease is a neurodegenerative condition caused by neuronal loss in several brain structures. Parkinson’s disease is characterized by tremors, rigidity or stiffness throughout the body, and impaired balance and coordination.
“Although Parkinson’s disease is primarily considered a motor disorder, several studies have shown non-motor symptoms are common across all stages of the disease,” Dr. Arrigo said. “However, these symptoms are often undiagnosed because patients are unaware of the link to the disease and, as a result, they may be under-treated.”
Non-motor symptoms experienced by patients with Parkinson’s disease include visual alterations such as an inability to perceive colors, a change in visual acuity, and a decrease in blinking which can lead to dry eye.
“These non-motor Parkinson’s symptoms may precede the appearance of motor signs by more than a decade,” Dr. Arrigo said.
The study of 20 newly diagnosed and not yet treated patients (11 men, 9 women) with Parkinson’s disease and 20 age- and gender-matched healthy controls involved a multi-disciplinary team of researchers in ophthalmology, neurology and neuroradiology of the University of Messina, Italy. MRI was performed on both the healthy controls and the patients, who underwent imaging within four weeks of their diagnosis. Researchers used an MRI technique called diffusion weighted imaging to assess white matter changes and voxel-based morphometry (VBM) to investigate concentration changes of brain’s gray and white matter. All study participants also had ophthalmologic examinations.
The researchers found significant abnormalities within the visual system brain structures of Parkinson’s disease patients, including alterations of optic radiations, a reduction of white matter concentration and a reduction of optic chiasm volume. The optic chiasm is the part of the brain where the left and right optic nerves intersect.
“The study in depth of visual symptoms may provide sensitive markers of Parkinson’s disease,” Dr. Arrigo said. “Visual processing metrics may prove helpful in differentiating Parkinsonism disorders, following disease progression, and monitoring patient response to drug treatment.”
Dr. Arrigo added that future studies are needed to better understand the timing of degeneration along visual pathways, as well as the specific changes.
“We’re excited by our findings,” he said. “However, this is just a starting point.”
“Visual System Involvement in Patients with Newly Diagnosed Parkinson Disease.” Collaborating with Dr. Arrigo were Alessandro Calamuneri, Ph.D., Demetrio Milardi, M.D., Enricomaria Mormina, M.D., Laura Rania, M.D., Elisa Postorino, M.D., Silvia Marino, M.D., Giuseppe Di Lorenzo, M.D., Giuseppe Pio Anastasi, M.D., Maria Felice Ghilardi, M.D., Pasquale Aragona, M.D., Angelo Quartarone, M.D., and Michele Gaeta, M.D.
Radiology is edited by Herbert Y. Kressel, M.D., Harvard Medical School, Boston, Mass., and owned and published by the Radiological Society of North America, Inc. (http://radiology.rsna.org/)
RSNA is an association of over 54,600 radiologists, radiation oncologists, medical physicists and related scientists, promoting excellence in patient care and health care delivery through education, research and technologic innovation. The Society is based in Oak Brook, Ill. (RSNA.org)
For patient-friendly information on Parkinson’s disease, visit RadiologyInfo.org.
Images (.JPG and .TIF format):
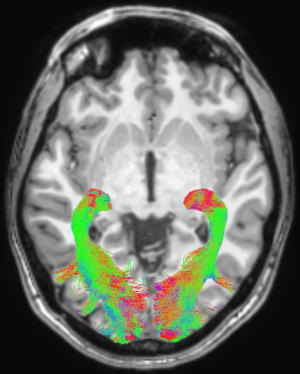
Figure 1. Left and right optic radiation (OR) image in a representative subject overlaid onto a T1-weighted axial volume image of the same subject. OR images were obtained on the basis of diffusion-weighted volume images by means of constrained spherical deconvolution fitting and related tractography. Each bundle was automatically colored according to tract main directionality: red for left to right, green for anterior to posterior, and blue for inferior to superior.
High-res (TIF) version
(Right-click and Save As)
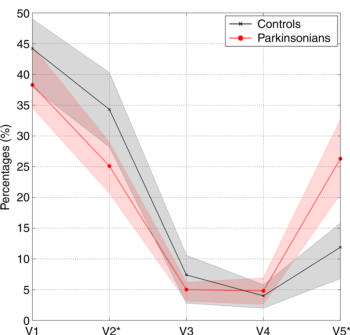
Figure 2. Graph shows average connectivity profiles of optic radiation in control subjects (black line) and patients with Parkinson disease (red line). Shaded areas surrounding each line represent 95 percent confidence intervals. * = statistically significant differences (P = .003) in distributions between groups.
High-res (TIF) version
(Right-click and Save As)
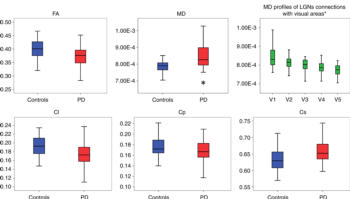
Figure 3. Box and whisker plots show average quantitative analysis of optic radiation diffusion parameters for patients with Parkinson disease (PD) (red box) and control subjects (blue box). Statistically significant increase in mean diffusivity (MD) (P = .014) in PD group was detected, as well as a significant linear decreasing of mean diffusivity profiles (P < .0001) related to lateral geniculate nucleus connections with each visual area is shown in green boxes upper right panel. Green boxes represent pooled data (ie, control subjects and PD together). * = statistically significant differences (P = .003) in distributions between groups. Cl = linear coefficient, Cp = planar coefficient, Cs = spherical coefficient.
High-res (TIF) version
(Right-click and Save As)
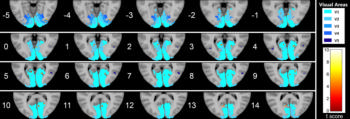
Figure 4. Series of axial section images show T1-weighted imaging–based voxel-based morphometry analysis of occipital cortex. Statistically significant reduction in clusters of gray matter concentration in Parkinson disease group compared with that in control subjects is shown. Only clusters comprising at least five suprathreshold voxels and involving at least one visual area were included in the analysis and are shown in the figure. To help visualization, shaded blue circles were added to highlight all clusters.
High-res (TIF) version
(Right-click and Save As)
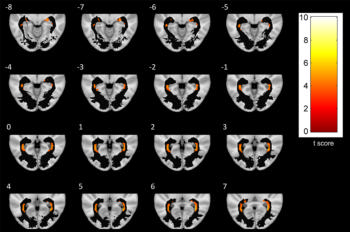
Figure 5. A series of axial-section images show white matter (WM) voxel-based morphometry analysis of posterior WM regions. Statistically significant reduction in clusters of WM concentration is shown in patients with Parkinson disease. Only clusters comprising at least five suprathreshold voxels and involving optic radiation (OR) were included in analysis and are shown in the figure. To help visualization, OR mask was visualized as a black region of interest.
High-res (TIF) version
(Right-click and Save As)
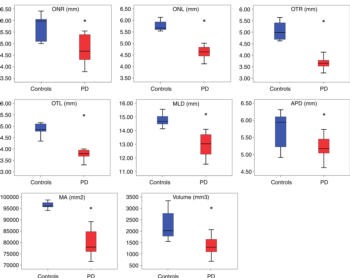
Figure 6. Morphometric analyses of optic chiasm for patients with Parkinson disease (red box) and control subjects (blue box). The following measures were considered: right optic nerve (ONR), left optic nerve (ONL), right optic tract (OTR), left optic tract (OTL), mediolateral diameter (MLD), anteroposterior diameter (APD), maximal area (MA), and volume. All measures are given in millimeters. * = statistically significant difference.
High-res (TIF) version
(Right-click and Save As)
