Artificial Intelligence May Help Diagnose Tuberculosis in Remote Areas
Released: April 24, 2017
At A Glance
- Deep learning methods applied to chest X-rays were able to identify cases of TB with an accuracy of 96 percent.
- Deep learning may help screening and evaluation efforts in TB-prevalent areas that typically lack radiology interpretation expertise.
- TB is one of the top 10 causes of death worldwide.
- RSNA Media Relations
1-630-590-7762
media@rsna.org - Linda Brooks
1-630-590-7738
lbrooks@rsna.org
OAK BROOK, Ill. — Researchers are training artificial intelligence models to identify tuberculosis (TB) on chest X-rays, which may help screening and evaluation efforts in TB-prevalent areas with limited access to radiologists, according to a new study appearing online in the journal Radiology.

According to the World Health Organization, TB is one of the top 10 causes of death worldwide. In 2016, approximately 10.4 million people fell ill from TB, resulting in 1.8 million deaths. TB can be identified on chest imaging, however TB-prevalent areas typically lack the radiology interpretation expertise needed to screen and diagnose the disease.
“There is a tremendous interest in artificial intelligence, both inside and outside the field of medicine,” said study co-author Paras Lakhani, M.D., from Thomas Jefferson University Hospital (TJUH) in Philadelphia. “An artificial intelligence solution that could interpret radiographs for presence of TB in a cost-effective way could expand the reach of early identification and treatment in developing nations.”
Deep learning is a type of artificial intelligence that allows computers to complete tasks based on existing relationships of data. A deep convolutional neural network (DCNN), modeled after brain structure, employs multiple hidden layers and patterns to classify images.
For the study, Dr. Lakhani and his colleague, Baskaran Sundaram, M.D., obtained 1,007 X-rays of patients with and without active TB. The cases consisted of multiple chest X-ray datasets from the National Institutes of Health, the Belarus Tuberculosis Portal, and TJUH. The datasets were split into training (68.0 percent), validation (17.1 percent), and test (14.9 percent).
The cases were used to train two different DCNN models – AlexNet and GoogLeNet – which learned from TB-positive and TB-negative X-rays. The models’ accuracy was tested on 150 cases that were excluded from the training and validation datasets.
The best performing artificial intelligence model was a combination of the AlexNet and GoogLeNet, with a net accuracy of 96 percent.
“The relatively high accuracy of the deep learning models is exciting,” Dr. Lakhani said. “The applicability for TB is important because it’s a condition for which we have treatment options. It’s a problem that can be solved.”
The two DCNN models had disagreement in 13 of the 150 test cases. For these cases, the researchers evaluated a workflow where an expert radiologist was able to interpret the images, accurately diagnosing 100 percent of the cases. This workflow, which incorporated a human in the loop, had a greater net accuracy of close to 99 percent.
“Application of deep learning to medical imaging is a relatively new field,” Dr. Lakhani said. “In the past, other machine learning approaches could only get to a certain accuracy level of around 80 percent. However, with deep learning, there is potential for more accurate solutions, as this research has shown.”
Dr. Lakhani said that the team plans to further improve the models with mores training cases and other deep learning methods.
“We hope to prospectively apply this in a real world environment,” he said. “An artificial intelligence solution using chest imaging can play a big role in tackling TB.”
“Deep Learning at Chest Radiography: Automated Classification of Pulmonary Tuberculosis by Using Convolutional Neural Networks.”
Radiology is edited by Herbert Y. Kressel, M.D., Harvard Medical School, Boston, Mass., and owned and published by the Radiological Society of North America, Inc. (http://pubs.rsna.org/journal/radiology)
RSNA is an association of over 54,600 radiologists, radiation oncologists, medical physicists and related scientists, promoting excellence in patient care and health care delivery through education, research and technologic innovation. The Society is based in Oak Brook, Ill. (RSNA.org)
For patient-friendly information on chest imaging, visit RadiologyInfo.org.
Press Resources:
Images (.JPG and .TIF format)
and Video clips (.mp4 format)
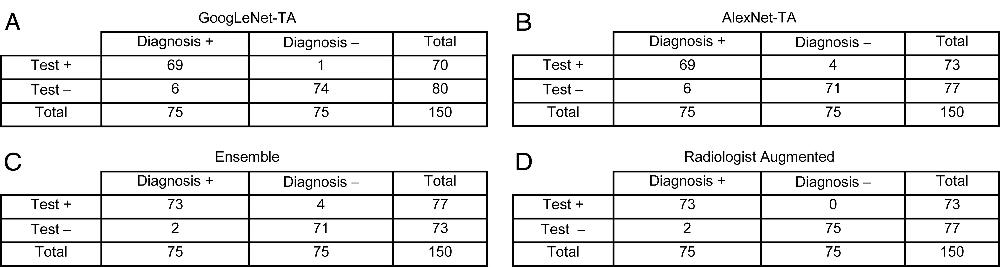
Figure 1. Contingency tables. A, Sensitivity, 92.0 percent (95 percent confidence interval: 83.3 percent, 96.6 percent); specificity, 98.7 percent (95 percent confidence interval: 92.1 percent, 100 percent); accuracy, 95.3 percent (95 percent confidence interval: 90.5 percent, 97.9 percent). B, Sensitivity, 92.0 percent (95 percent confidence interval: 83.3 percent, 96.6 percent); specificity, 94.7 percent (95 percent confidence interval: 86.7 percent, 98.3 percent); accuracy, 93.3 percent (95 percent confidence interval: 88.0 percent, 96.5 percent). C, Sensitivity, 97.3 percent (95 percent confidence interval: 90.2 percent, 99.8 percent); specificity, 94.7 percent (95 percent confidence interval: 86.7 percent, 98.3 percent); accuracy, 96.0 percent (95 percent confidence interval: 91.4 percent, 98.3 percent). D, Sensitivity, 97.3 percent (95 percent confidence interval: 90.2 percent, 99.8 percent); specificity, 100 percent (95 percent confidence interval: 95.8 percent, 100 percent); accuracy, 98.7 percent (95 percent confidence interval: 95.0 percent, 99.9 percent).
High-res (TIF) version
(Right-click and Save As)
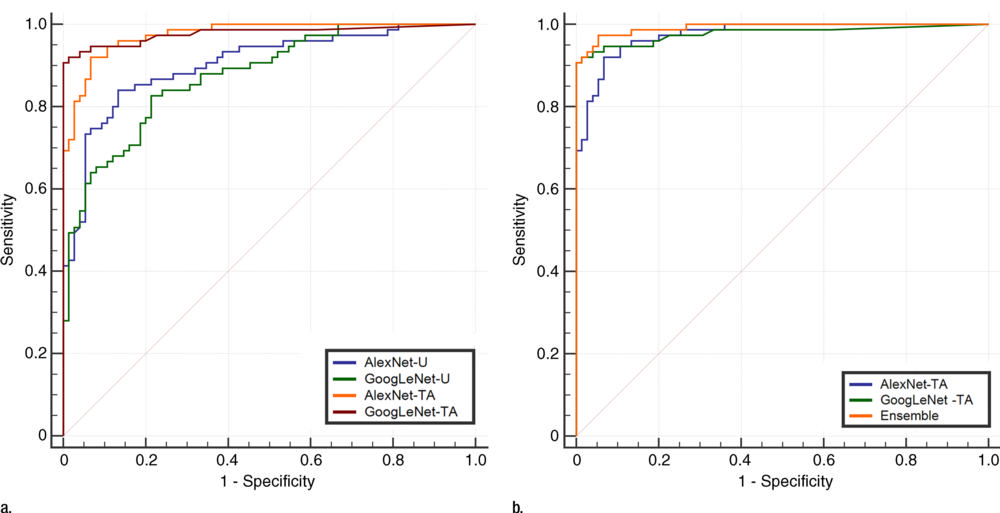
Figure 2. (a) Comparison of receiver operating characteristic curves for the untrained AlexNet-U and GoogLeNet-U models and pretrained with augmentation AlexNet-TA and GoogLeNet-TA models. The receiver operating characteristic curves for the AlexNet-TA and GoogLeNet-TA models had an area under the curve (AUC) that was significantly greater than that for the untrained AlexNet-U and GoogLeNet-U models (P < .001). (b) Comparison of receiver operating characteristic curves for the AlexNet-TA, GoogLeNet-TA, and ensemble of the two models. The ensemble provided the best AUC.
High-res (TIF) version
(Right-click and Save As)
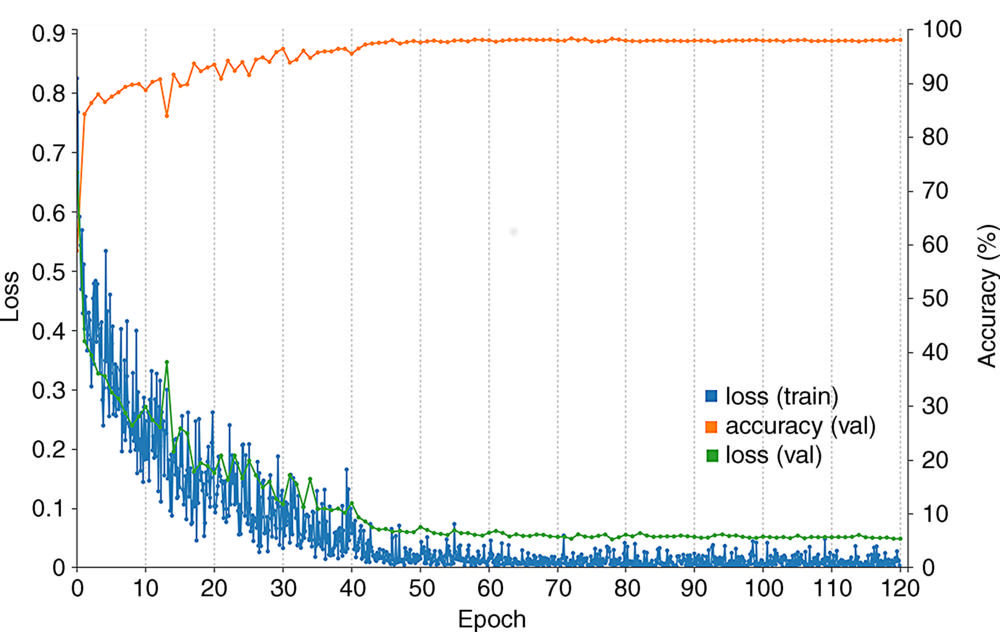
Figure 3. Training curve of AlexNet-TA classifier. The orange line represents the accuracy over the course of training, which increases over time, with a final accuracy of 98.2 percent at the final epoch. Training was performed for 120 epochs, and each epoch represents one pass through the entire training dataset. The blue and green curves represent the loss on the training and validation datasets, which decreases over time. The loss represents the fit between a prediction and the ground truth label. As expected, there is a reduction of loss over the course of training as accuracy improves. The loss on the validation is similar to the training, which indicates that there is no appreciable overfitting. These training curves are used for model selection. In this case, the best performing model at epoch 120 was used on the test data for final assessment. Val = validation.
High-res (TIF) version
(Right-click and Save As)
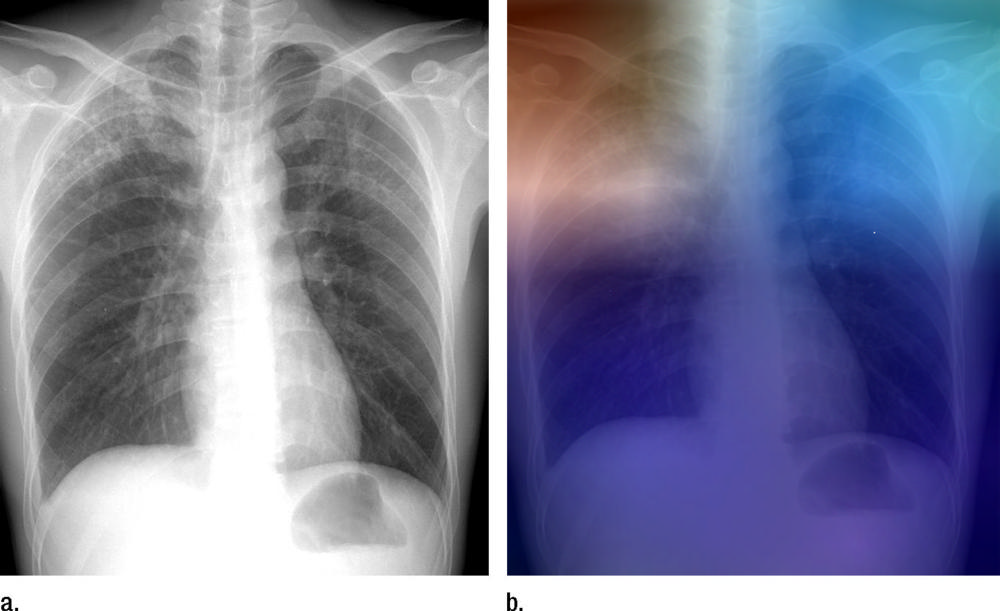
Figure 4. (a) Posteroanterior chest radiograph shows upper lobe opacities with pathologic analysis–proven active TB. (b) Same posteroanterior chest radiograph, with a heat map overlay of one of the strongest activations obtained from the fifth convolutional layer after it was passed through the GoogLeNet-TA classifier. The red and light blue regions in the upper lobes represent areas activated by the deep neural network. The dark purple background represents areas that are not activated. This shows that the network is focusing on parts of the image where the disease is present (both upper lobes).
High-res (TIF) version
(Right-click and Save As)
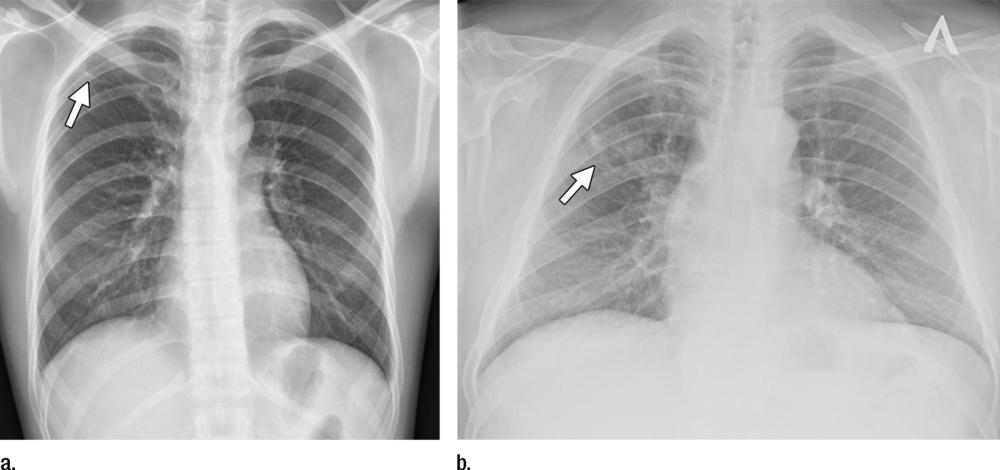
Figure 5. Two images with false-negative findings missed by both classifiers. (a) An opacity in the right upper lobe (arrow) on a posteroanterior radiograph. (b) A more apparent right suprahilar opacity (arrow) on a posteroanterior radiograph.
High-res (TIF) version
(Right-click and Save As)