Deep Learning Model Classifies Brain Tumors with Single MRI Scan
Released: August 11, 2021
At A Glance
- A deep learning model is capable of classifying brain tumors using a single 3D MRI scan.
- The model achieved an accuracy of 93.35% across seven classes.
- Researchers claim the model can be extended to other brain tumor types or neurological disorders.
- RSNA Media Relations
1-630-590-7762
media@rsna.org - Linda Brooks
1-630-590-7738
lbrooks@rsna.org - Katherine Anderson
1-630-491-1009
kanderson@rsna.org
OAK BROOK, Ill. — A team of researchers at Washington University School of Medicine have developed a deep learning model that is capable of classifying a brain tumor as one of six common types using a single 3D MRI scan, according to a study published in Radiology: Artificial Intelligence.

“This is the first study to address the most common intracranial tumors and to directly determine the tumor class or the absence of tumor from a 3D MRI volume,” said Satrajit Chakrabarty, M.S., a doctoral student under the direction of Aristeidis Sotiras, Ph.D., and Daniel Marcus, Ph.D., in Mallinckrodt Institute of Radiology’s Computational Imaging Lab at Washington University School of Medicine in St. Louis, Missouri.
The six most common intracranial tumor types are high-grade glioma, low-grade glioma, brain metastases, meningioma, pituitary adenoma and acoustic neuroma. Each was documented through histopathology, which requires surgically removing tissue from the site of a suspected cancer and examining it under a microscope.
According to Chakrabarty, machine and deep learning approaches using MRI data could potentially automate the detection and classification of brain tumors.
“Non-invasive MRI may be used as a complement, or in some cases, as an alternative to histopathologic examination,” he said.
To build their machine learning model, called a convolutional neural network, Chakrabarty and researchers from Mallinckrodt Institute of Radiology developed a large, multi-institutional dataset of intracranial 3D MRI scans from four publicly available sources. In addition to the institution’s own internal data, the team obtained pre-operative, post-contrast T1-weighted MRI scans from the Brain Tumor Image Segmentation, The Cancer Genome Atlas Glioblastoma Multiforme, and The Cancer Genome Atlas Low Grade Glioma.
The researchers divided a total of 2,105 scans into three subsets of data: 1,396 for training, 361 for internal testing and 348 for external testing. The first set of MRI scans was used to train the convolutional neural network to discriminate between healthy scans and scans with tumors, and to classify tumors by type. The researchers evaluated the performance of the model using data from both the internal and external MRI scans.
Using the internal testing data, the model achieved an accuracy of 93.35% (337 of 361) across seven imaging classes (a healthy class and six tumor classes). Sensitivities ranged from 91% to 100%, and positive predictive value—or the probability that patients with a positive screening test truly have the disease—ranged from 85% to 100%. Negative predictive values—or the probability that patients with a negative screening test truly don't have the disease—ranged from 98% to 100% across all classes. Network attention overlapped with the tumor areas for all tumor types.
For the external test dataset, which included only two tumor types (high-grade glioma and low-grade glioma), the model had an accuracy of 91.95%.
“These results suggest that deep learning is a promising approach for automated classification and evaluation of brain tumors,” Chakrabarty said. “The model achieved high accuracy on a heterogeneous dataset and showed excellent generalization capabilities on unseen testing data.”
Chakrabarty said the 3D deep learning model comes closer to the goal of an end-to-end, automated workflow by improving upon existing 2D approaches, which require radiologists to manually delineate, or characterize, the tumor area on an MRI scan before machine processing. The convolutional neural network eliminates the tedious and labor-intensive step of tumor segmentation prior to classification.
Dr. Sotiras, a co-developer of the model, said it can be extended to other brain tumor types or neurological disorders, potentially providing a pathway to augment much of the neuroradiology workflow.
“This network is the first step toward developing an artificial intelligence-augmented radiology workflow that can support image interpretation by providing quantitative information and statistics,” Chakrabarty added.
“MRI-based Identification and Classification of Major Intracranial Tumor Types Using a 3D Convolutional Neural Network: A Retrospective Multi-Institutional Analysis.” Collaborating with Satrajit Chakrabarty and Drs. Sotiras and Marcus were Mikhail Milchenko, Ph.D., Pamela LaMontagne, Ph.D., and Michael Hileman, B.S.
Radiology: Artificial Intelligence is edited by Charles E. Kahn Jr., M.D., M.S., Perelman School of Medicine at the University of Pennsylvania, and owned and published by the Radiological Society of North America, Inc. (https://pubs.rsna.org/journal/ai)
RSNA is an association of radiologists, radiation oncologists, medical physicists and related scientists promoting excellence in patient care and health care delivery through education, research and technologic innovation. The Society is based in Oak Brook, Illinois. (RSNA.org)
For information on imaging of brain tumors, visit RadiologyInfo.org.
Press Resources:
Images (JPG, TIF):
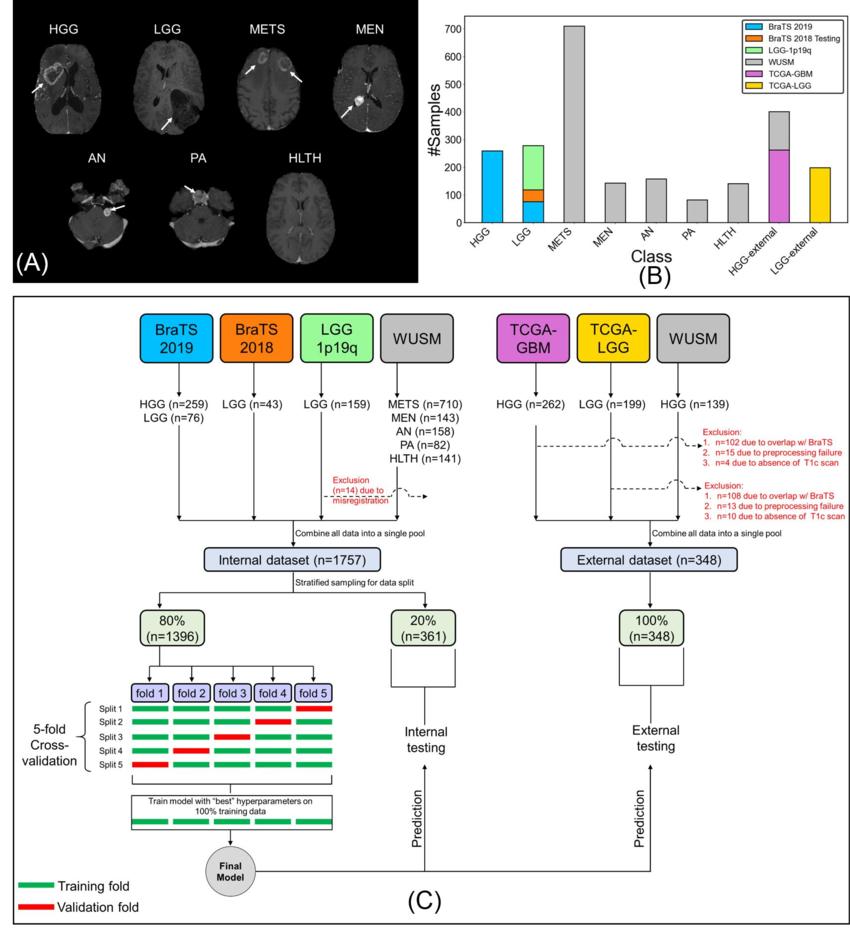
Figure 1. (A) Sample postcontrast T1-weighted scans (axial section, RAS orientation) for high-grade glioma (HGG), low-grade glioma (LGG), brain metastases (METS), acoustic neuroma (AN), pituitary adenoma (PA), meningioma (MEN), healthy (HLTH) classes included in the study (white arrows), (B) class-wise distribution of data, and (C) flow of images and data split for cross-validation, internal, and external testing. BraTS = Brain Tumor Image Segmentation, TCGA = The Cancer Genome Atlas, WUSM = Washington University School of Medicine.
High-res (TIF) version
(Right-click and Save As)
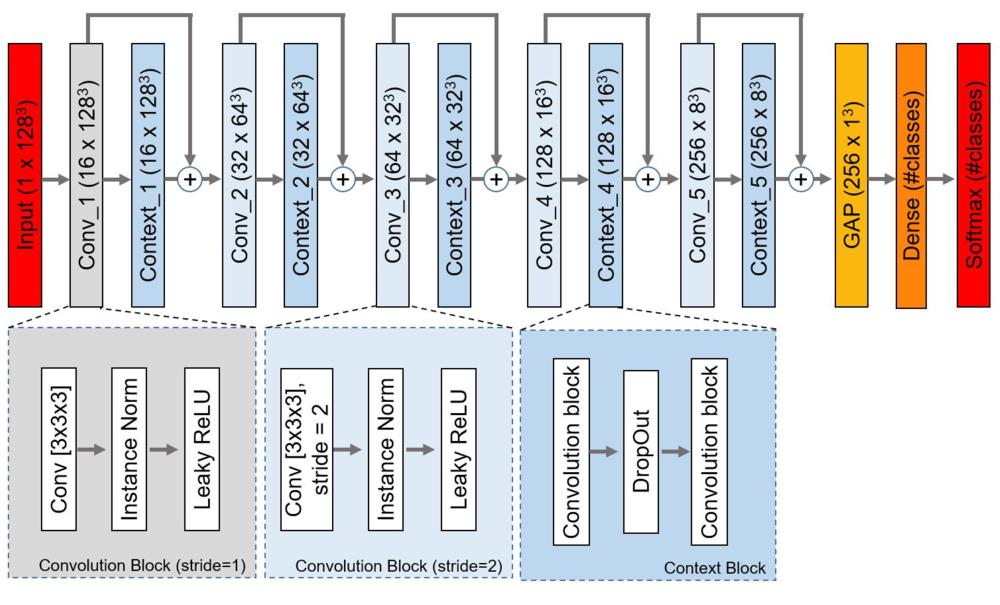
Figure 2. The proposed network architecture. Each rectangle contains the name of the block/layer and the dimension of the feature-map (#channels x height x width x depth) in parentheses. Conv = convolutional layer, Conv_i = ith convolutional block, Context_i = ith context block, GAP = global average pooling layer, Instance Norm = Instance Normalization layer, ReLU = rectified linear unit.
High-res (TIF) version
(Right-click and Save As)
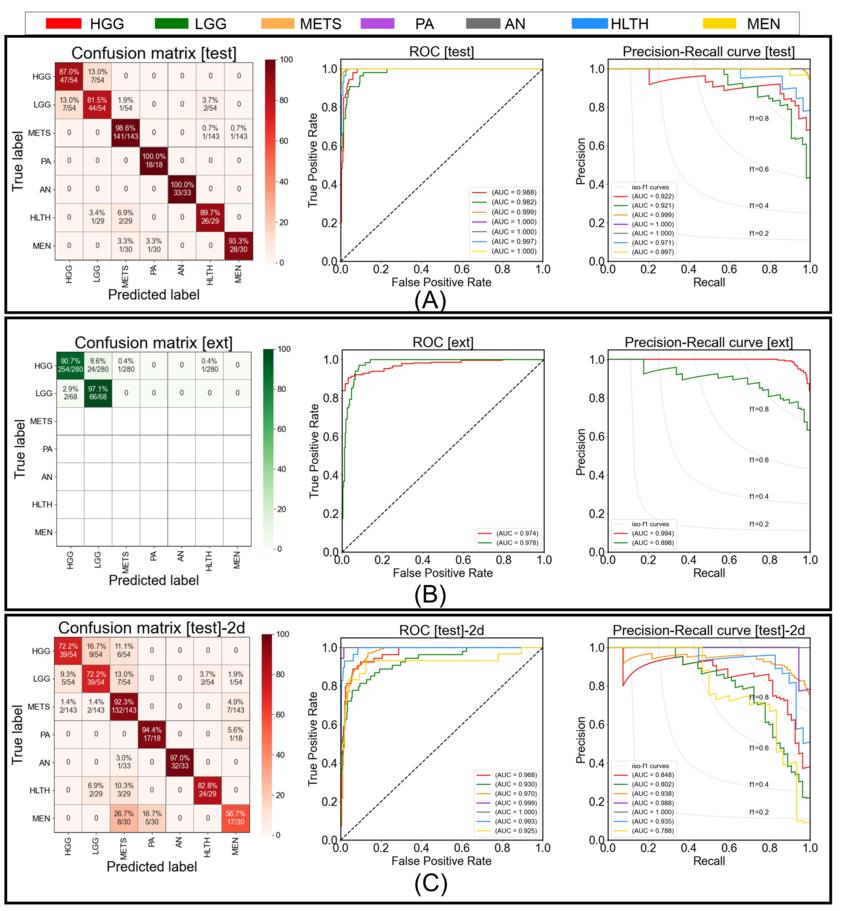
Figure 3. Figure shows the confusion matrix, receiver operating characteristic, and precision-recall curve for (A) testing performance by proposed model, (B) external-testing performance by proposed model, and (C) testing performance by 2D ResNet50 baseline. In confusion matrices, diagonal elements show the sensitivity per class and off-diagonal elements show the error distribution among different classes. HGG = high grade glioma, LGG = low grade glioma, METS = brain metastases, AN = acoustic neuroma, PA = pituitary adenoma, MEN = meningioma, HLTH = healthy individuals
High-res (TIF) version
(Right-click and Save As)
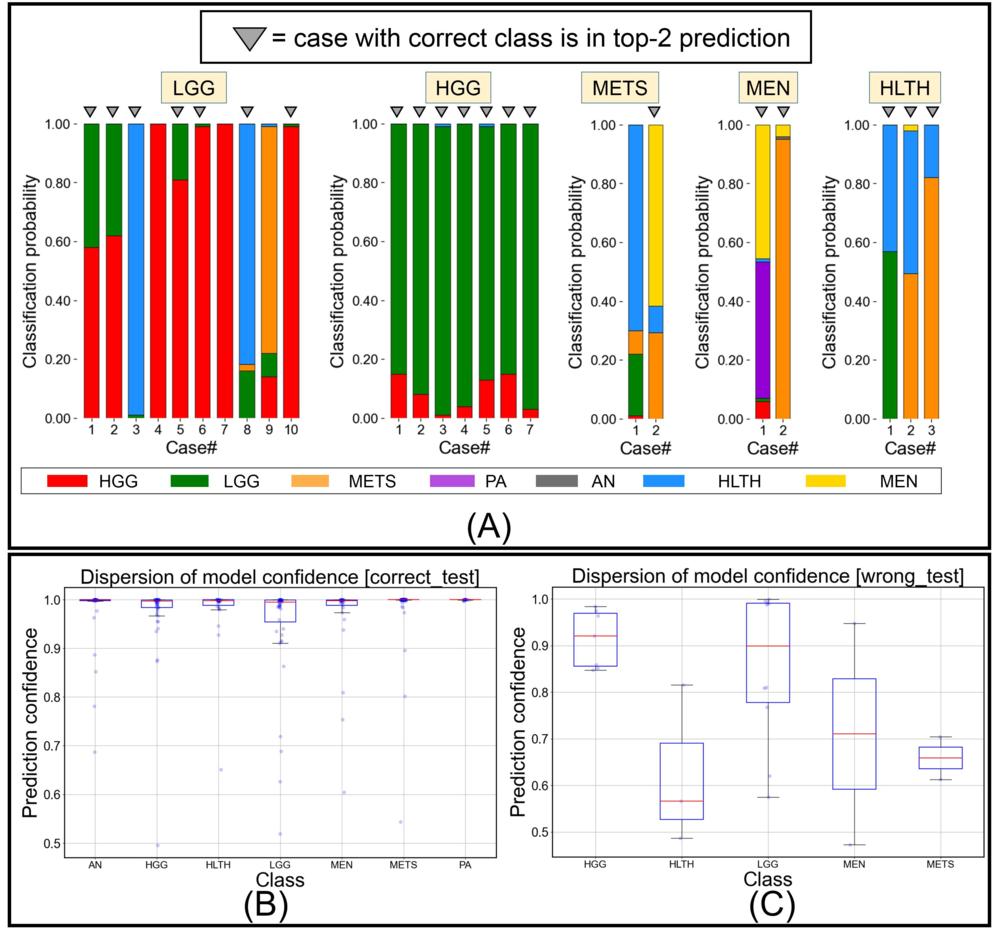
Figure 4. Figure shows (A) predicted class probabilities (y-axis) as stacked bar plots for all misclassified testing images (n = 24) (x-axis), (B) class-wise dispersion of prediction probability score for correctly classified testing images, and (C) class-wise dispersion of prediction probability score for incorrectly classified testing images. HGG = high grade glioma, LGG = low grade glioma, METS = brain metastases, AN = acoustic neuroma, PA = pituitary adenoma, MEN = meningioma, HLTH = healthy individual.
High-res (TIF) version
(Right-click and Save As)
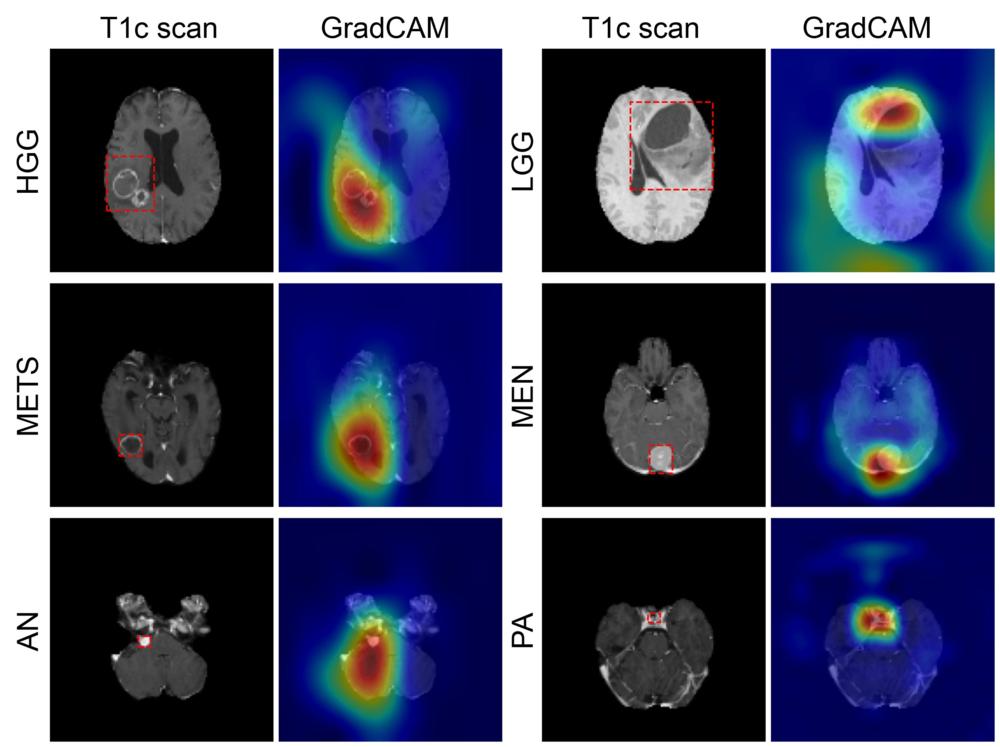
Figure 5. Figure shows coarse attention maps generated using GradCAM for correctly classified high-grade glioma (HGG), low-grade glioma (LGG), brain metastases (METS), meningioma (MEN), acoustic neuroma (AN), and pituitary adenoma (PA). For each pair, the postcontrast T1-weighted scan, and the GradCAM attention map (overlaid on scan) have been shown. In GradCAM maps, warmer and colder colors represent high and low contribution of pixels toward a correct prediction, respectively.
High-res (TIF) version
(Right-click and Save As)