AI Predicts Lung Cancer Risk
Released: May 18, 2021
At A Glance
- An artificial intelligence algorithm accurately predicts the risk that lung nodules detected on screening CT will become cancerous.
- The researchers trained the algorithm on CT images of more than 16,000 nodules, including 1,249 malignancies, from the National Lung Screening Trial.
- Lung cancer is the leading cause of cancer death worldwide, with an estimated 1.8 million deaths in 2020.
- RSNA Media Relations
1-630-590-7762
media@rsna.org - Linda Brooks
1-630-590-7738
lbrooks@rsna.org - Katherine Anderson
1-630-491-1009
kanderson@rsna.org
OAK BROOK, Ill. — An artificial intelligence (AI) program accurately predicts the risk that lung nodules detected on screening CT will become cancerous, according to a study published in the journal Radiology.
Lung cancer is the leading cause of cancer death worldwide, with an estimated 1.8 million deaths in 2020, according to the World Health Organization. Low-dose chest CT is used to screen people at a high risk of lung cancer, such as longtime smokers. It has been shown to significantly reduce lung cancer mortality, primarily by helping to detect cancers at an early stage when they are easier to treat successfully.
While lung cancer typically shows up as pulmonary nodules on CT images, most nodules are benign and do not require further clinical workup. Accurately distinguishing between benign and malignant nodules is therefore crucial to catch cancers early.
For the new study, researchers developed an algorithm for lung nodule assessment using deep learning, an AI application capable of finding certain patterns in imaging data. The researchers trained the algorithm on CT images of more than 16,000 nodules, including 1,249 malignancies, from the National Lung Screening Trial. They validated the algorithm on three large sets of imaging data of nodules from the Danish Lung Cancer Screening Trial.


The deep learning algorithm delivered excellent results, outperforming the established Pan-Canadian Early Detection of Lung Cancer model for lung nodule malignancy risk estimation. It performed comparably to 11 clinicians, including four thoracic radiologists, five radiology residents and two pulmonologists.
"The algorithm may aid radiologists in accurately estimating the malignancy risk of pulmonary nodules," said the study's first author, Kiran Vaidhya Venkadesh, a Ph.D. candidate with the Diagnostic Image Analysis Group at Radboud University Medical Center in Nijmegen, the Netherlands. "This may help in optimizing follow-up recommendations for lung cancer screening participants."
The algorithm potentially brings several additional benefits to the clinic, the researchers said.
"As it does not require manual interpretation of nodule imaging characteristics, the proposed algorithm may reduce the substantial interobserver variability in CT interpretation," said senior author Colin Jacobs, Ph.D., assistant professor in the Department of Medical Imaging at Radboud University Medical Center in Nijmegen. "This may lead to fewer unnecessary diagnostic interventions, lower radiologists' workload and reduce costs of lung cancer screening."
The researchers plan to continue improving the algorithm by incorporating clinical parameters like age, sex and smoking history.
They are also working on a deep learning algorithm that takes multiple CT examinations as input. The current algorithm is highly suitable for analyzing nodules at the initial, or baseline, screening, but for nodules detected at subsequent screenings, growth and appearance in comparison to the previous CT are important.
Dr. Jacobs and colleagues have developed other algorithms to reliably extract imaging features from the chest CT related to chronic obstructive pulmonary diseases and cardiovascular diseases. They will be investigating how to effectively integrate these imaging features into the current algorithm.
"Deep Learning for Malignancy Risk Estimation of Pulmonary Nodules Detected at Low-Dose Screening CT." Collaborating with Kiran V. Venkadesh and Colin Jacobs, Ph.D., were Arnaud A. A. Setio, Ph.D., Anton Schreuder, M.D., Ernst T. Scholten, M.D., Ph.D., Kaman Chung, M.D., Ph.D., Mathilde M. W. Wille, M.D., Ph.D., Zaigham Saghir, M.D., Ph.D., Bram van Ginneken, Ph.D., and Mathias Prokop, M.D., Ph.D.
Radiology is edited by David A. Bluemke, M.D., Ph.D., University of Wisconsin School of Medicine and Public Health, Madison, Wisconsin, and owned and published by the Radiological Society of North America, Inc. (https://pubs.rsna.org/journal/radiology)
RSNA is an association of radiologists, radiation oncologists, medical physicists and related scientists promoting excellence in patient care and health care delivery through education, research and technologic innovation. The Society is based in Oak Brook, Illinois. (RSNA.org)
For patient-friendly information on lung cancer screening, visit RadiologyInfo.org.
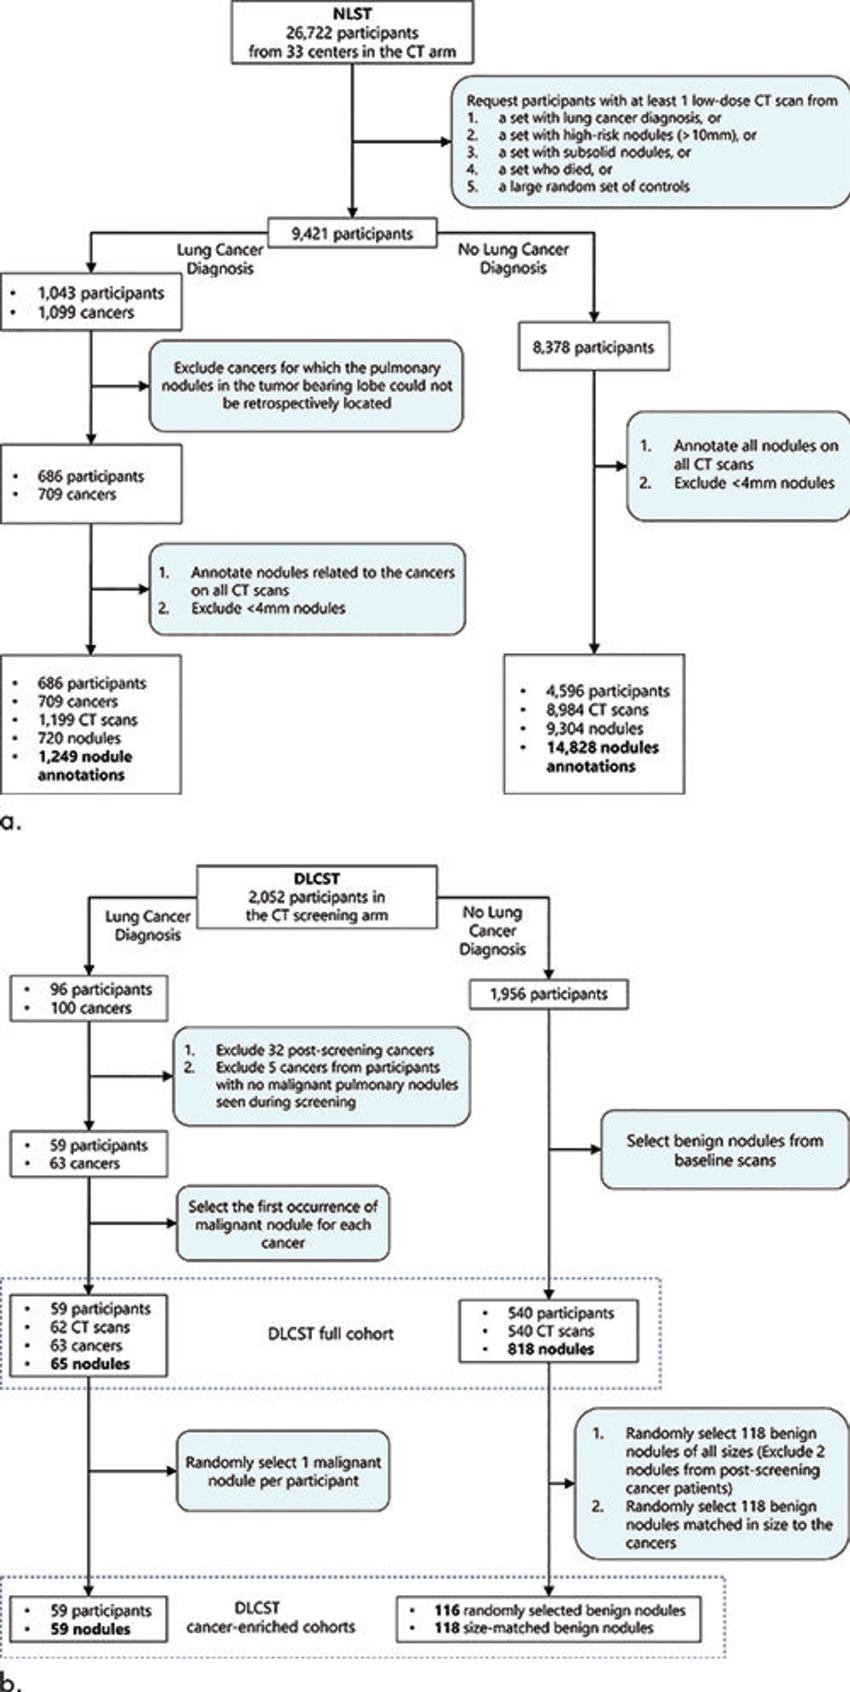
Figure 1. Flowchart shows the inclusion and exclusion criteria for pulmonary nodules from the National Lung Screening Trial (NLST) and the Danish Lung Cancer Screening Trial (DLCST). (a) Nodules from the NLST cohort were used for the development of the deep learning algorithm for malignancy risk estimation of pulmonary nodules detected at low-dose screening CT. (b) Nodules from the DLCST were used for external validation of the deep learning algorithm. The full baseline cohort (883 nodules) consisted of 65 malignant and 818 benign nodules. The cancer-enriched subset A consisted of 59 malignant and 116 randomly selected benign nodules. The cancer-enriched subset B consisted of the same 59 malignant nodules but with 118 size-matched benign nodules.
High-res (TIF) version
(Right-click and Save As)
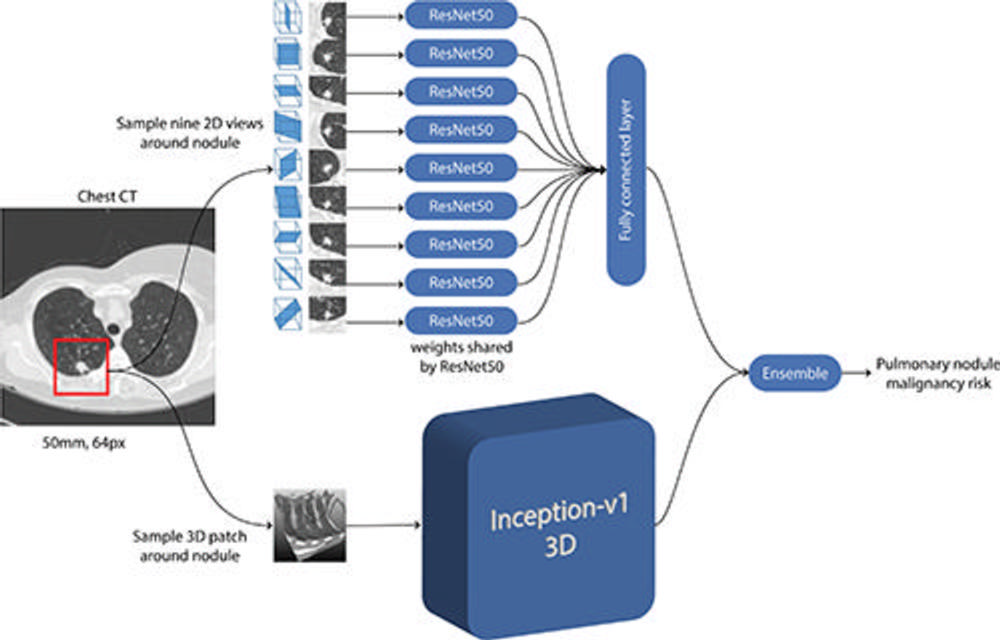
Figure 2. Schematic representation of convolutional neural networks (CNNs) used in the deep learning algorithm for malignancy risk estimation of pulmonary nodules detected at low-dose screening CT. Given a CT image and the coordinate of the pulmonary nodule, a three-dimensional (3D) patch that was 50 mm in size and resampled to 64 pixels (px) in each direction was extracted around the nodule. For the two-dimensional (2D) CNN, nine different views were sectioned from the three-dimensional patch. Features were extracted with a ResNet50 CNN for each two-dimensional view, and the features were combined in a fully connected layer. For the three-dimensional CNN, the entire three-dimensional patch was fed as input to an Inceptionv1 three-dimensional CNN. Both architectures had a final layer that produced a continuous output. Finally, the outputs from the two-dimensional and three-dimensional CNNs were averaged in an ensemble to compute the pulmonary nodule malignancy risk between 0 and 1.
High-res (TIF) version
(Right-click and Save As)
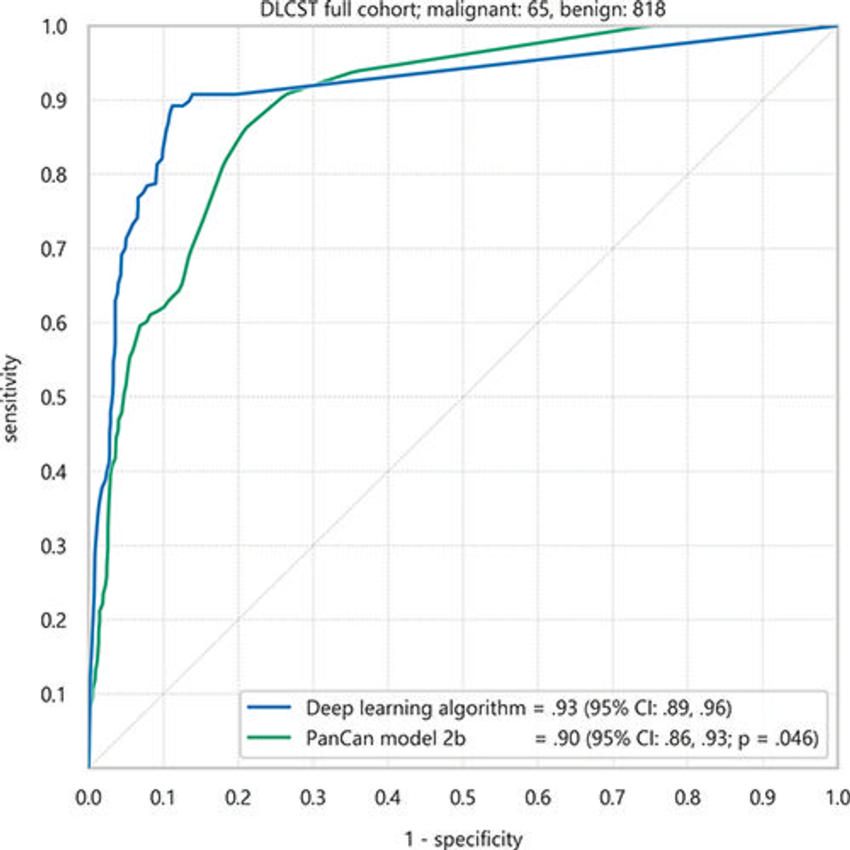
Figure 3. Receiver operating characteristic curves of the deep learning algorithm and Pan-Canadian Early Detection of Lung Cancer (PanCan) model for discrimination of malignant nodules from benign nodules in the full Danish Lung Cancer Screening Trial (DLCST) cohort of 883 nodules. Areas under the receiver operating characteristic curve and 95% CIs (in parentheses) are shown.
High-res (TIF) version
(Right-click and Save As)
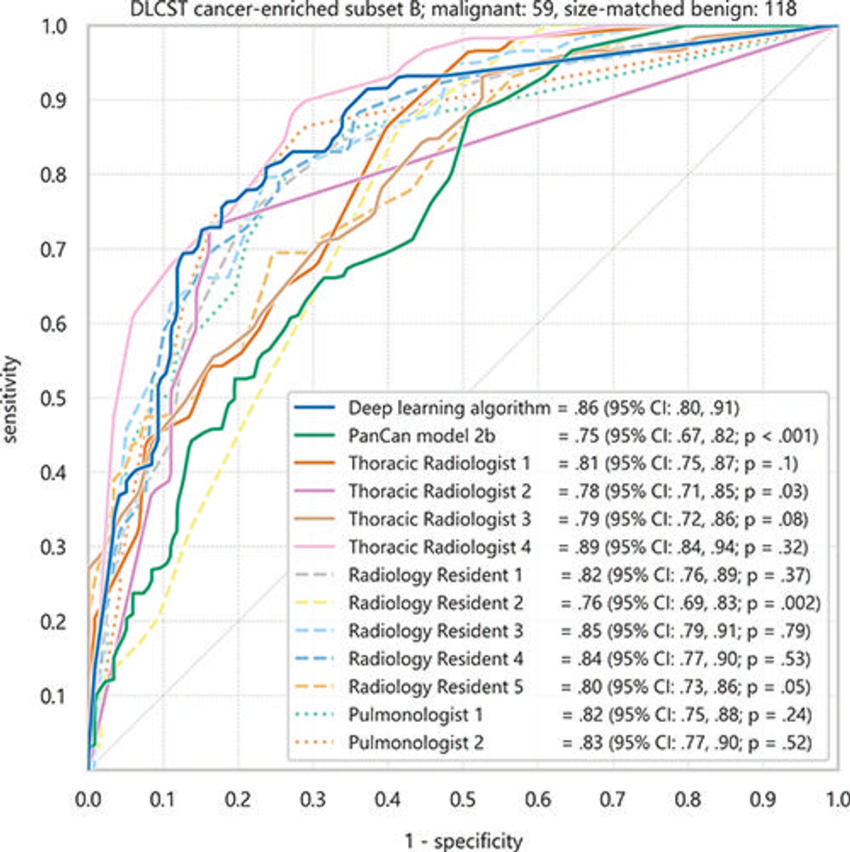
Figure 4. Receiver operating characteristic curves of the deep learning algorithm, clinicians, and Pan-Canadian Early Detection of Lung Cancer (PanCan) model for discrimination of malignant nodules from size-matched benign nodules in the cancer-enriched subset B of 177 nodules from the Danish Lung Screening Trial (DLCST). Areas under the receiver operating characteristic curve and 95% CIs (in parentheses) are shown.
High-res (TIF) version
(Right-click and Save As)
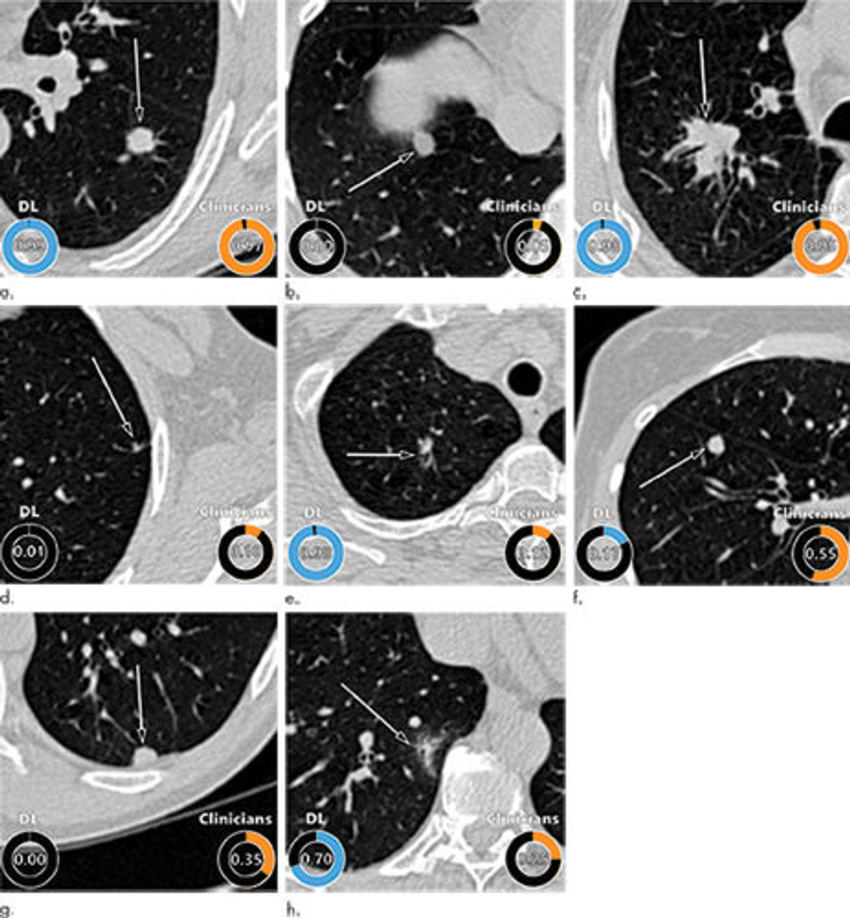
Figure 5. Examples of CT images in nodules from the Danish Lung Cancer Screening Trial (DLCST) with (a–d) high and (e–h) low agreement between the deep learning (DL) algorithm and the clinicians for malignancy risk estimation. Numbers in rings on bottom left of each image are the algorithm’s malignancy score, and numbers in rings on bottom right of each image are the clinicians’ median malignancy score. The extent of the color filling is proportional to the malignancy risk (on a scale of 0 to 1, where 0 represents the lowest risk and 1 represents the highest risk). (a) Image shows a 15-mm spiculated and lobulated malignant nodule (arrow) classified correctly by the DL algorithm and clinicians. (b) Image shows an 11-mm smooth benign nodule (arrow) classified correctly by the DL algorithm and clinicians. (c) Image shows a 29-mm benign lesion (arrow) suspected to be a malignant nodule by both the DL algorithm and clinicians. This participant was diagnosed with pneumonia at clinical workup. (d) Image shows a 5-mm malignant nodule (arrow) called benign by both the DL algorithm and clinicians. The growth of the nodule can be seen from follow-up CT examinations. (e) Image shows a 15-mm part-solid malignant nodule (arrow) classified correctly by the DL algorithm and not suspected to be malignant by seven of 11 clinicians. (f) Image shows an 8-mm benign nodule (arrow) predicted to be moderately suspicious by the clinicians and called benign by the DL algorithm. (g) Image shows an 11-mm malignant nodule (arrow) predicted to be moderately suspicious by most clinicians but called benign by the DL algorithm. (h) Image shows a 16-mm benign lesion (arrow) classified correctly by the clinicians and predicted to be highly suspicious by the DL algorithm.
High-res (TIF) version
(Right-click and Save As)
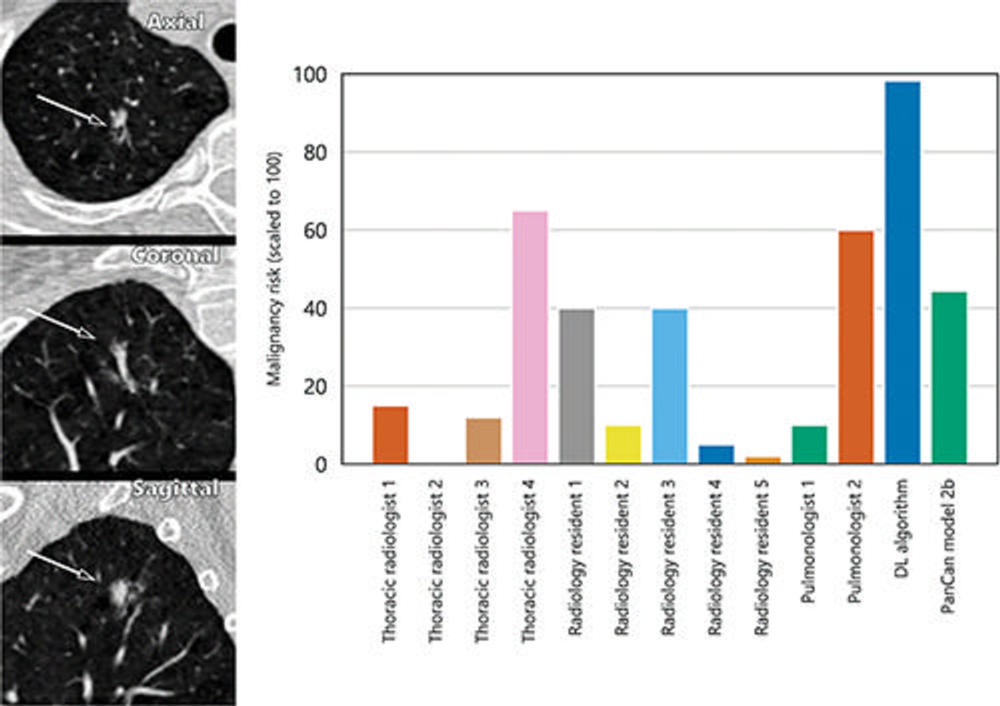
Figure 6. A 15-mm part-solid malignant nodule from the Danish Lung Cancer Screening Trial (DLCST) as seen from the axial, coronal, and sagittal views (left side). The nodule was found in the right upper lobe and the bar graph (right side) shows that the nodule was not suspected to be malignant by most clinicians, except for one thoracic radiologist and a pulmonologist. The deep learning (DL) algorithm classified this nodule correctly as malignant.
High-res (TIF) version
(Right-click and Save As)