Chest CT Illuminates Mortality Risk in People with COPD
Released: April 06, 2021
At A Glance
- Body composition information derived from routine chest CTs can provide important information on the overall health of people with COPD.
- Intermuscular fat was associated with higher mortality rates, while the distribution of subcutaneous fat, in contrast, was linked to lower risks of all-cause mortality.
- CT-derived body composition assessments could provide an opportunity for earlier intervention in patients who face a higher risk of adverse health events.
- RSNA Media Relations
1-630-590-7762
media@rsna.org - Linda Brooks
1-630-590-7738
lbrooks@rsna.org - Katherine Anderson
1-630-491-1009
kanderson@rsna.org
OAK BROOK, Ill. — Body composition information derived from routine chest CTs can provide important information on the overall health of people with chronic obstructive pulmonary disease (COPD), including their risk of all-cause mortality, according to a study published in Radiology.

COPD is a group of chronic, progressive lung diseases like emphysema and chronic bronchitis that affect about 30 million people in the United States alone. It is frequently associated with obesity and sarcopenia, a loss of muscle mass and strength. Obesity is associated with lower mortality in patients with COPD. The longer survival rates of obese patients compared to leaner counterparts, a phenomenon known as the “obesity paradox,” has been suggested in several chronic illnesses.
Chest CT is often used to characterize COPD, screen for lung cancer, or plan for surgical options. Beyond lung assessment, these exams offer an opportunity to assess obesity and sarcopenia through soft-tissue biomarkers.
“Chest CT scans have long focused on the lungs or heart,” said study coauthor and Radiology editor David A. Bluemke, M.D., Ph.D., from the University of Wisconsin School of Medicine and Public Health in Madison, Wisconsin. “Few prior investigators have evaluated muscle quality, bone density, or degeneration of the spine as an index of overall health. These are readily available and quantifiable in these CT examinations.”

For the new study, Dr. Bluemke, along with Farhad Pishgar, M.D., M.P.H., and Shadpour Demehri, M.D., from Johns Hopkins School of Medicine, and colleagues used chest CT exams to study the associations between imaging-derived soft tissue markers and all-cause mortality in COPD.
The study group was made up of 2,994 participants drawn from the Multi-Ethnic Study of Atherosclerosis (MESA), a large trial investigating the roles of imaging-derived soft-tissue and bone markers for predicting outcomes relevant to cardiopulmonary diseases. Of the 265 patients in the study group with COPD, 49 (18%) died over the follow-up period.
A greater amount of intermuscular fat was associated with higher mortality rates. Existing research has linked higher levels of intermuscular fat with diabetes and insulin resistance.

Higher subcutaneous adipose tissue, in contrast, was linked to lower risks of all-cause mortality.
The authors convincingly showed fat in the muscle was much more predictive of bad outcomes than a simple distribution of subcutaneous fat.
The findings point to a role for body composition assessment in people with COPD who undergo chest CT. Such assessments are readily obtainable in clinical practice.
In theory, CT-derived body composition assessments would provide an opportunity for earlier interventions in patients who face a higher risk of adverse health events.
Body composition assessments taken from chest CT also present an opportunity for artificial intelligence-derived algorithms that could quickly and automatically add risk assessment to the imaging report.
“I expect that more studies in the future will begin looking at all information on the CT, rather than just one organ at a time,” Dr. Bluemke said. “Clinicians will need thresholds when to intervene when fat or bone abnormalities become severe.”
The study was just the latest to tap into imaging data from the MESA trial, a collaboration involving more than 6,000 men and women from six communities across the United States.
“Quantitative Analysis of Adipose Depots by Using Chest CT and Associations with All-Cause Mortality in Chronic Obstructive Pulmonary Disease: Longitudinal Analysis from MESArthritis Ancillary Study.” Collaborating with Drs. Bluemke, Pishgar and Demehri were Mahsima Shabani, M.D., M.P.H., Thiago Quinaglia A. C. Silva, M.D., Ph.D., Matthew Budoff, M.D., R. Graham Barr, M.D., Dr.P.H., Matthew A. Allison, M.D., M.P.H., Wendy S. Post, M.D., M.S., and João A. C. Lima, M.B.A., M.D.
Radiology is edited by David A. Bluemke, M.D., Ph.D., University of Wisconsin School of Medicine and Public Health, Madison, Wisconsin, and owned and published by the Radiological Society of North America, Inc. (https://pubs.rsna.org/journal/radiology)
RSNA is an association of radiologists, radiation oncologists, medical physicists and related scientists promoting excellence in patient care and health care delivery through education, research and technologic innovation. The Society is based in Oak Brook, Illinois. (RSNA.org)
For patient-friendly information on chest CT, visit RadiologyInfo.org.
Images (JPG, TIF):
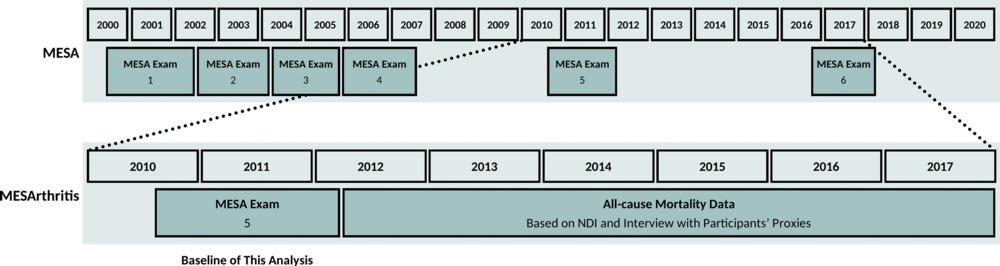
Figure 1. Timeline of the MESArthritis ancillary study. MESA = Multi-Ethnic Study of Atherosclerosis, NDI = National Death Index.
High-res (TIF) version
(Right-click and Save As)
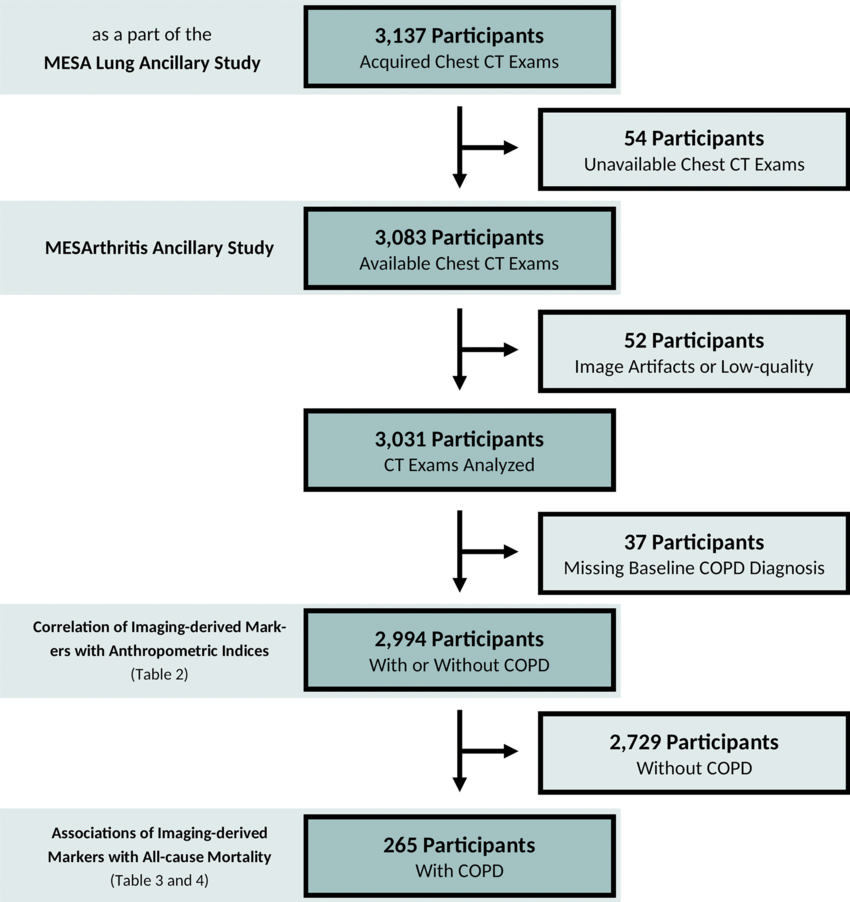
Figure 2. Flow diagram of the MESArthritis ancillary study. COPD = chronic obstructive pulmonary disease, MESA = Multi-Ethnic Study of Atherosclerosis.
High-res (TIF) version
(Right-click and Save As)
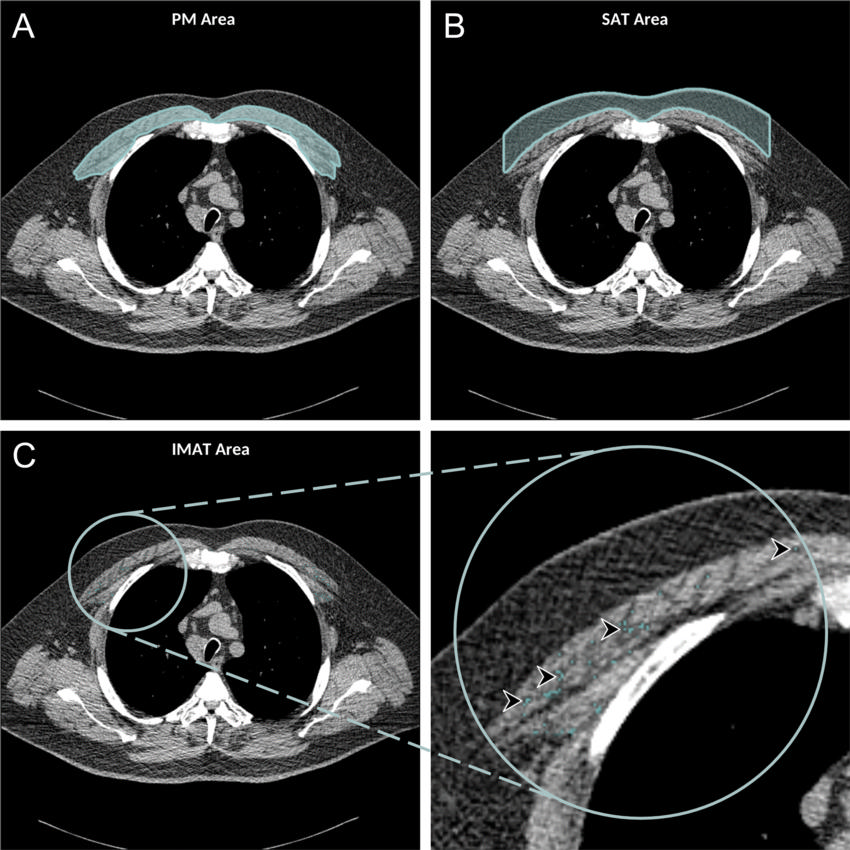
Figure 3. Axial chest CT examination in a 54-year-old participant. A, On the axial noncontrast chest CT image, the pectoralis muscle (PM) area was segmented and measured in the section above the aortic arch. B, The subcutaneous adipose tissue (SAT) area as the area between the PM and the skin surface on the same section was also measured and the attenuation of pixels in the SAT area was used to determine the individualized threshold for the intermuscular adipose tissue (IMAT). C, The IMAT within the PM was segmented as the areas with Hounsfield units below this threshold for the IMAT (arrowheads).
High-res (TIF) version
(Right-click and Save As)
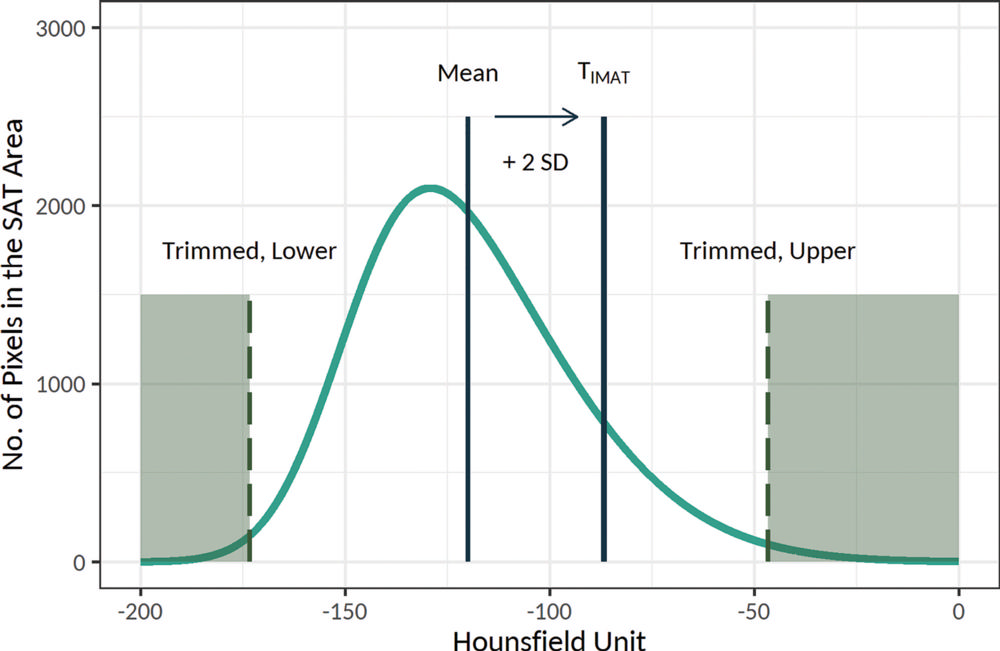
Figure 4. Schematic presentation of the threshold for the intramuscular adipose tissue (IMAT), or TIMAT, calculation method. Histogram of the attenuation of the subcutaneous adipose tissue (SAT) area was used to determine the individualized threshold for the IMAT (the figure is schematic and not to scale). In this method, after trimming the lower and upper 30% of values, the threshold for the IMAT was calculated as mean + 2 × standard deviation (SD) of the attenuation of the remaining pixels. The IMAT within pectoralis muscle was defined as the summated areas of pixels with attenuation below the threshold for the IMAT.
High-res (TIF) version
(Right-click and Save As)
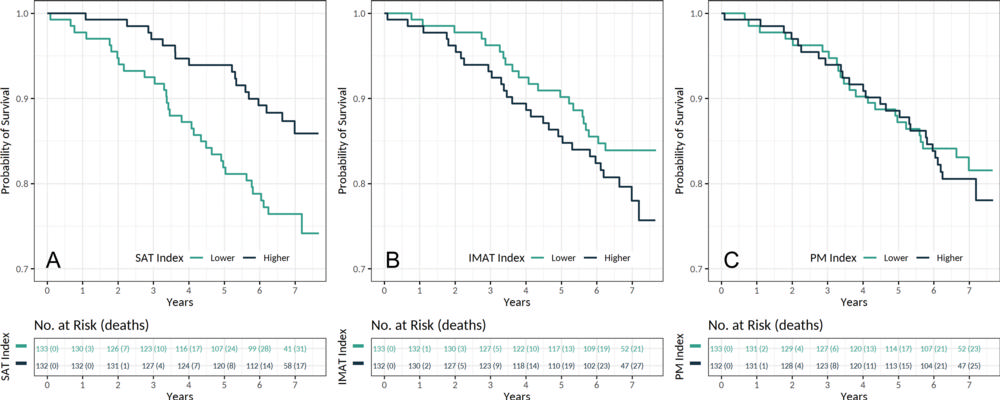
Figure 5. Kaplan-Meier estimates for survival in patients with chronic obstructive pulmonary disease according to the, A, subcutaneous adipose tissue (SAT), B, intermuscular adipose tissue (IMAT), and, C, pectoralis muscle (PM) indexes (n = 265). Indexes were categorized by using median values.
High-res (TIF) version
(Right-click and Save As)