Deep Learning Model Provides Rapid Detection of Stroke-causing Blockages
Released: September 29, 2020
At A Glance
- Researchers explored the use of deep learning to help provide rapid detection of large vessel blockages on CT angiography to reduce time to treatment.
- Blockages in the arteries that supply oxygenated blood to the brain account for a significant proportion of ischemic strokes.
- The deep learning model detected all 31 large vessel occlusions seen in 62 patients for a sensitivity of 100%.
- RSNA Media Relations
1-630-590-7762
media@rsna.org - Linda Brooks
1-630-590-7738
lbrooks@rsna.org
OAK BROOK, Ill. — A sophisticated type of artificial intelligence (AI) called deep learning can help rapidly detect blockages in the arteries that supply blood to the head, potentially speeding the onset of life-saving treatment, according to a study published in Radiology.
Large vessel occlusions are blockages in the arteries that supply oxygenated blood to the brain. These occlusions account for a significant proportion of ischemic strokes, the most common type of stroke. Prompt diagnosis is critical in order to begin recanalization, or opening of the blocked artery, through a treatment known as endovascular therapy.
“Minutes matter in this time-sensitive diagnosis,” said study lead author Matthew T. Stib, M.D., a radiology resident at the Warren Alpert Medical School at Brown University in Providence, Rhode Island. “Every minute that we reduce the time to recanalization extends the patient’s disability-free life by a week.”
CT angiography (CTA), a three-minute exam that provides detailed views of the blood vessels, is the gold standard for detecting these occlusions. Radiologists are highly accurate at identifying large vessel occlusions on CTA, but they are not always available, and any backlogs at the hospital can further delay care.
Dr. Stib and his colleagues at Brown explored the use of deep learning to help provide rapid detection of large vessel occlusions on CTA and reduce time to treatment.
Working closely with Brown’s computer science department, the researchers developed a deep learning model from scratch. They used a large sample of CTA examinations for patients with suspected acute ischemic stroke to train the algorithm to recognize the appearance of large vessel occlusions and distinguish it from other conditions. Preprocessing of the CTA exams included the creation of maximum intensity projection images to emphasize the contrast-enhanced vasculature. The researchers also used multiphase CTA, a newer approach that provides more comprehensive information than the single-phase technique.
When they tested the deep learning model on multiphase CTA examinations of 62 patients, the model detected all 31 large vessel occlusions for a sensitivity of 100%, a statistically significant improvement over the 77% sensitivity rate of single-phase CTA. The use of multiphase CTA contributed to the improved performance.
“These results are quite promising,” Dr. Stib said. “We really wanted to optimize the sensitivity of the model so that we were sure that we picked up every single case because missing a case has pretty dire consequences.”
The study is the first to use multiphase CTA to look at occlusions in both the arteries of the front, or anterior, part of the head and neck and those in the back, or posterior.
“Posterior circulation occlusions have not been discussed much in machine learning literature,” Dr. Stib said. “They’re less common but have pretty profound clinical consequences if missed. It’s important to have an algorithm that detects all categories of occlusion, both anterior and posterior.”
The next step in the research is to validate the results using the algorithm in real time and see if it can improve outcomes for patients. If the results hold up, then the deep learning model could be a useful asset in medical centers or hospitals that don’t have the expertise for reading large vessel occlusion CTA images.
“This algorithm is not replacing the ability of radiologists to do their job; rather, it’s trying to speed up the time to diagnosis,” Dr. Stib said. “So if the radiologist isn’t around or there is a large workflow that is preventing someone from looking at the exam results quickly, there will be an alert that says an occlusion may be present and someone should look at this. That’s where the value is in this kind of a model.”
The team worked under the direction of the study’s senior author Ryan A. McTaggart, M.D., a neuroradiologist specializing in interventional neuroradiology at Rhode Island Hospital in Providence, Rhode Island, and proponent of decreasing the time to treatment for large vessel occlusions.
“Detecting Large Vessel Occlusion at Multiphase CT Angiography by Using a Deep Convolutional Neural Network.” Collaborating with Drs. Stib and McTaggart were Justin Vasquez, M.S., Mary P. Dong, Yun Ho Kim, Sumera S. Subzwari, Harold J. Triedman, Amy Wang, Hsin-Lei Charlene Wang, B.A., Anthony D. Yao, B.S., Mahesh Jayaraman, M.D., Jerrold L. Boxerman, M.D., Ph.D., Carsten Eickhoff, Ph.D., Ugur Cetintemel, Ph.D., and Grayson L. Baird, Ph.D.
Radiology is edited by David A. Bluemke, M.D., Ph.D., University of Wisconsin School of Medicine and Public Health, Madison, Wisconsin, and owned and published by the Radiological Society of North America, Inc. (https://pubs.rsna.org/journal/radiology)
RSNA is an association of radiologists, radiation oncologists, medical physicists and related scientists promoting excellence in patient care and health care delivery through education, research and technologic innovation. The Society is based in Oak Brook, Illinois. (RSNA.org)
For patient-friendly information on CT angiography, visit RadiologyInfo.org.
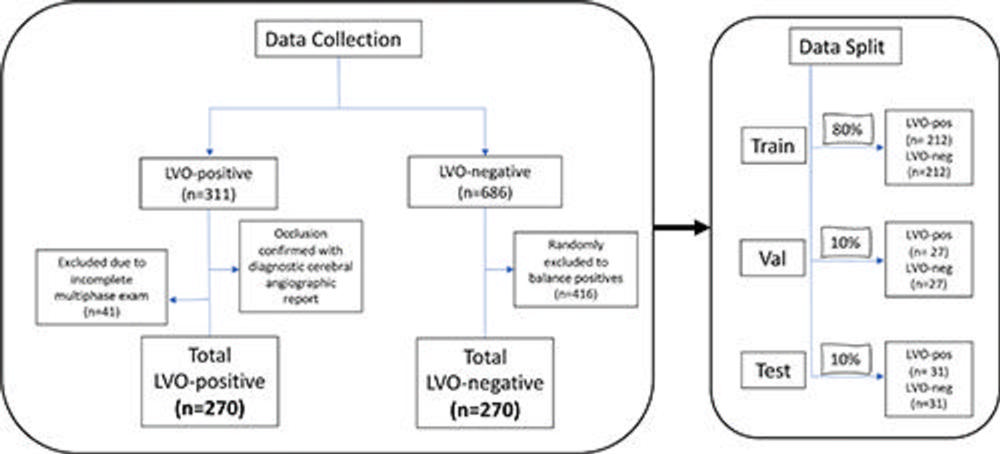
Figure 1. Flowchart demonstrates data collection and split. Consecutive multiphase CT angiography examinations in patients with and without large vessel occlusion (LVO) were collected. LVO-positive (pos) patients were excluded if there was an incomplete multiphase CT angiography study. The LVO-negative (neg) patients were balanced to the positive cases and were age and sex matched. The final data split corresponded to 80%, 10%, and 10% (training, validation [val], and test, respectively) with each split containing an equal number of patients positive and negative for LVO.
High-res (TIF) version
(Right-click and Save As)
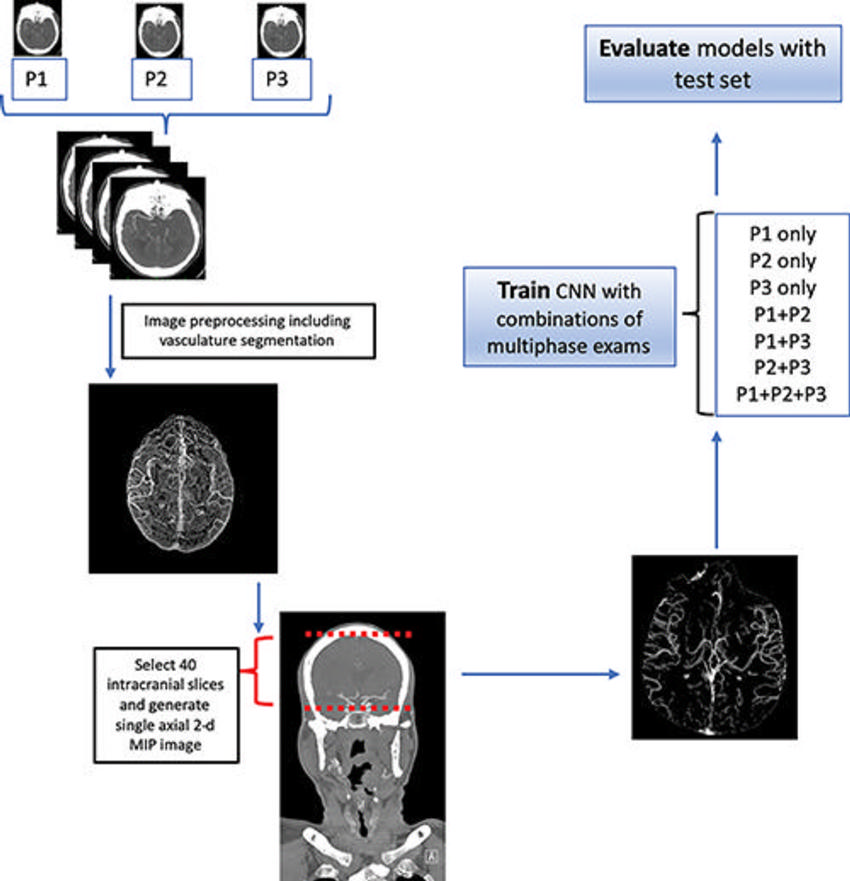
Figure 2. Flowchart demonstrates data preprocessing and experimental setup. The three phases (P1, P2, and P3) of the multiphase examination each underwent a preprocessing pipeline that included vasculature segmentation. Because the relevant information was contained in the downstream intracranial vasculature, we selected the 40 most-cranial axial slices from the circle of Willis to the skull vertex. These 40 axial slices were then converted into a single axial two-dimensional (2-d) maximum intensity projection (MIP) image as the input to our convolutional neural network (CNN). A total of seven experimental combinations were performed and each model was evaluated on the held-out test set.
High-res (TIF) version
(Right-click and Save As)
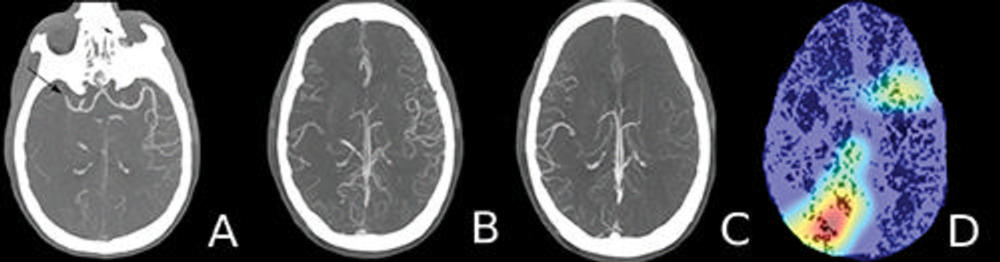
Figure 3. Axial maximum intensity projection images and a heat map in a 60-year old man who presented to the emergency department with new onset left-sided weakness. A, Arterial (phase 1) image shows an abrupt occlusion of the distal M1 branch of the right middle cerebral artery (arrow) with paucity of distal vasculature. B, Venous (phase 2) image shows subtle asymmetry with minimal increased vascularity in the contralateral left hemisphere. C, Late venous (phase 3) image shows prominent increased opacification of the ipsilateral right hemispheric vasculature downstream from the occlusion. D, Heat map shows the most discriminative region (red) that the model used for the correct prediction.
High-res (TIF) version
(Right-click and Save As)
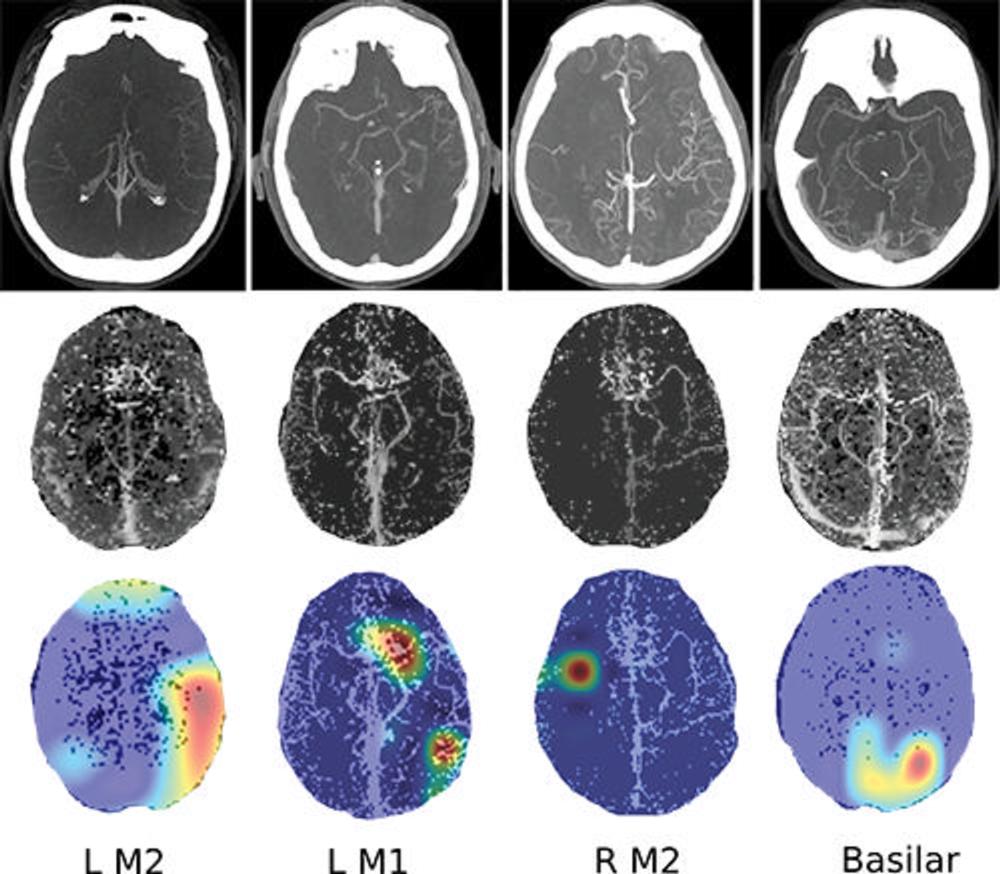
Figure 4. Images show four separate patients with large vessel occlusions correctly predicted by the algorithm. The top row shows a representative CT slice from the delayed venous phase CT angiography. The middle row shows the preprocessed maximum intensity projection images that function as the input to the model. The bottom row are overlaid heat maps, with areas in red showing the most discriminative regions. Notice these so-called hot regions correlate with the occlusion location (respectively: left [L] M2, L M1, right [R] M2, basilar) in each patient.
High-res (TIF) version
(Right-click and Save As)
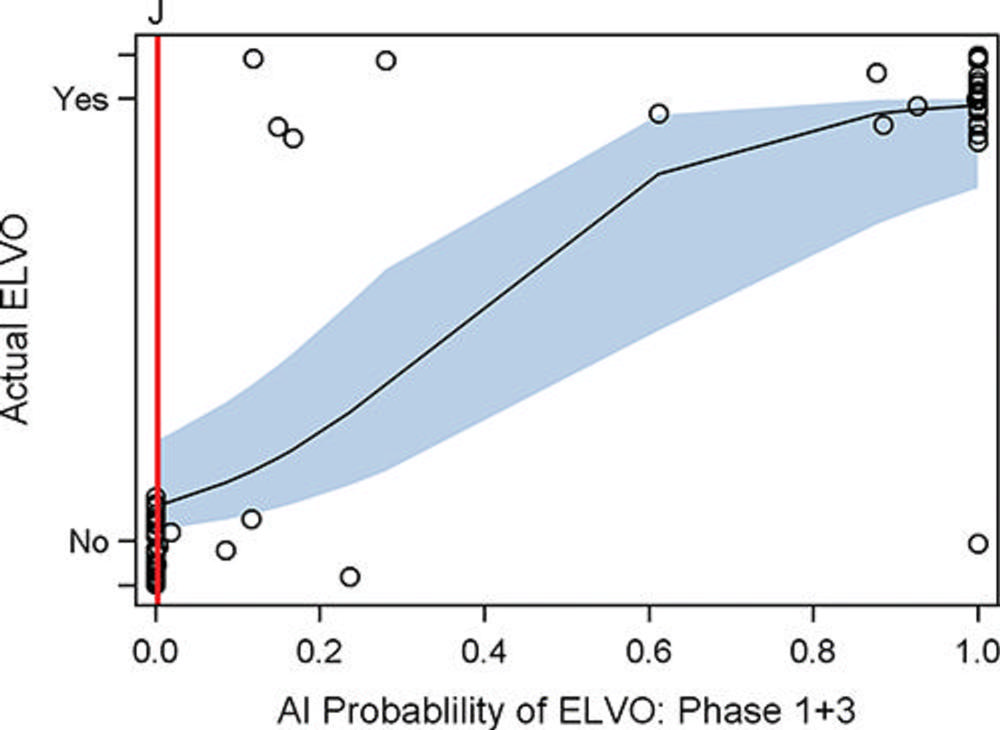
Figure 5. Graph shows artificial intelligence (AI) large vessel occlusion (LVO) prediction score versus presence or absence of LVO for the combination of phase 1 and 3 (arterial and late venous phase). Y-axis represents the binary ground truth of presence or absence of LVO. The x-axis shows the probability range (from 0 to 1.0) of the model predicting the presence of LVO. The solid black line represents the relationship between the likelihood of presence or absence of LVO and prediction score (slope), while the light blue band represents the 95% confidence band of the slope. The red line corresponds to the Youden J cutoff value. The circles represent observed data points. ELVO = emergent LVO.
High-res (TIF) version
(Right-click and Save As)
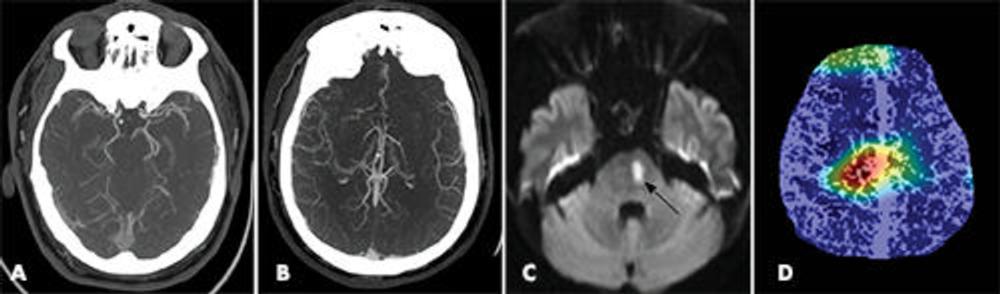
Figure 6. Images show false-positive finding prediction in a 52-year-old man who presented with acute stroke symptoms to the emergency department. A, Axial arterial phase CT angiography and, B, axial venous phase CT angiography images show no evidence of a large vessel occlusion. Additional noncontrast-enhanced brain CT images (not shown) did not show evidence of acute infarct. C, Diffusion-weighted MRI performed 6 hours after presentation shows an area of restricted diffusion consistent with an acute infarct in the left paramedian pons (arrow). D, Heat map overlay shows focal activity projecting over the central brain.
High-res (TIF) version
(Right-click and Save As)