Long Spaceflights Affect Astronaut Brain Volume
Released: April 14, 2020
At A Glance
- MRI results showed that long-duration microgravity exposure caused expansion in astronauts’ brain and cerebrospinal fluid volumes.
- Most of the astronauts also had MRI evidence of pituitary gland deformation.
- The astronauts’ combined brain and cerebrospinal fluid volumes remained elevated at one-year postflight, suggesting permanent alteration.
- RSNA Media Relations
1-630-590-7762
media@rsna.org - Linda Brooks
1-630-590-7738
lbrooks@rsna.org - Dionna Arnold
1-630-590-7791
darnold@rsna.org
OAK BROOK, Ill. — Extended periods in space have long been known to cause vision problems in astronauts. Now a new study in the journal Radiology suggests that the impact of long-duration space travel is more far-reaching, potentially causing brain volume changes and pituitary gland deformation.

More than half of the crew members on the International Space Station (ISS) have reported changes to their vision following long-duration exposure to the microgravity of space. Postflight evaluation has revealed swelling of the optic nerve, retinal hemorrhage and other ocular structural changes.
Scientists have hypothesized that chronic exposure to elevated intracranial pressure, or pressure inside the head, during spaceflight is a contributing factor to these changes. On Earth, the gravitational field creates a hydrostatic gradient, a pressure of fluid that progressively increases from your head down to your feet while standing or sitting. This pressure gradient is not present in space.
“When you’re in microgravity, fluid such as your venous blood no longer pools toward your lower extremities but redistributes headward,” said study lead author Larry A. Kramer, M.D., from the University of Texas Health Science Center at Houston. Dr. Kramer further explained, “That movement of fluid toward your head may be one of the mechanisms causing changes we are observing in the eye and intracranial compartment.”
To find out more, Dr. Kramer and colleagues performed brain MRI on 11 astronauts, including 10 men and one woman, before they traveled to the ISS. The researchers followed up with MRI studies a day after the astronauts returned, and then at several intervals throughout the ensuing year.
MRI results showed that the long-duration microgravity exposure caused expansions in the astronauts’ combined brain and cerebrospinal fluid (CSF) volumes. CSF is the fluid that flows in and around the hollow spaces of the brain and spinal cord. The combined volumes remained elevated at one-year postflight, suggesting permanent alteration.
“What we identified that no one has really identified before is that there is a significant increase of volume in the brain’s white matter from preflight to postflight,” Dr. Kramer said. “White matter expansion in fact is responsible for the largest increase in combined brain and cerebrospinal fluid volumes postflight.”
MRI also showed alterations to the pituitary gland, a pea-sized structure at the base of the skull often referred to as the “master gland” because it governs the function of many other glands in the body. Most of the astronauts had MRI evidence of pituitary gland deformation suggesting elevated intracranial pressure during spaceflight.
“We found that the pituitary gland loses height and is smaller postflight than it was preflight,” Dr. Kramer said. “In addition, the dome of the pituitary gland is predominantly convex in astronauts without prior exposure to microgravity but showed evidence of flattening or concavity postflight. This type of deformation is consistent with exposure to elevated intracranial pressures.”
The researchers also observed a postflight increase in volume, on average, in the astronauts’ lateral ventricles, spaces in the brain that contain CSF. However, the overall resulting volume would not be considered outside the range of healthy adults. The changes were similar to those that occur in people who have spent long periods of bed rest with their heads tilted slightly downward in research studies simulating headward fluid shift in microgravity.
Additionally, there was increased velocity of CSF flow through the cerebral aqueduct, a narrow channel that connects the ventricles in the brain. A similar phenomenon has been seen in normal pressure hydrocephalus, a condition in which the ventricles in the brain are abnormally enlarged. Symptoms of this condition include difficulty walking, bladder control problems and dementia. To date, these symptoms have not been reported in astronauts after space travel.
The researchers are studying ways to counter the effects of microgravity. One option under consideration is the creation of artificial gravity using a large centrifuge that can spin people in either a sitting or prone position. Also under investigation is the use of negative pressure on the lower extremities as a way to counteract the headward fluid shift due to microgravity.
Dr. Kramer said the research could also have applications for non-astronauts.
“If we can better understand the mechanisms that cause ventricles to enlarge in astronauts and develop suitable countermeasures, then maybe some of these discoveries could benefit patients with normal pressure hydrocephalus and other related conditions,” he said.
“Intracranial Effects of Microgravity: A Prospective Longitudinal MRI Study.” Collaborating with Dr. Kramer were Khader M. Hasan, Ph.D., Michael B. Stenger, Ph.D., Ashot Sargsyan, M.D., Steven S. Laurie, Ph.D., Christian Otto, M.D., M.M.Sc., Robert J. Ploutz-Snyder, Ph.D., P.Stat., Karina Marshall-Goebel, Ph.D., Roy F. Riascos, M.D., and Brandon R. Macias, Ph.D.
Radiology is edited by David A. Bluemke, M.D., Ph.D., University of Wisconsin School of Medicine and Public Health, Madison, Wis., and owned and published by the Radiological Society of North America, Inc. (http://radiology.rsna.org/)
RSNA is an association of radiologists, radiation oncologists, medical physicists and related scientists promoting excellence in patient care and health care delivery through education, research and technologic innovation. The Society is based in Oak Brook, Ill. (RSNA.org)
For patient-friendly information on brain MRI, visit RadiologyInfo.org.
Images (JPG, TIF):
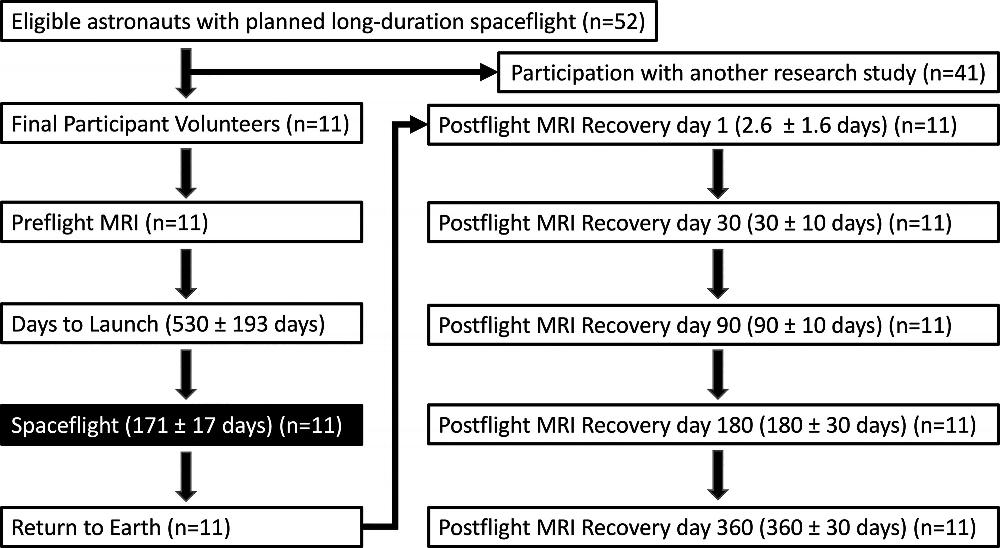
Figure 1. Flowchart shows sequence of events from the selection of eligible astronauts, preflight MRI, launch, spaceflight, return to earth, and five sequential postflight recovery MRI examinations.
High-res (TIF) version
(Right-click and Save As)
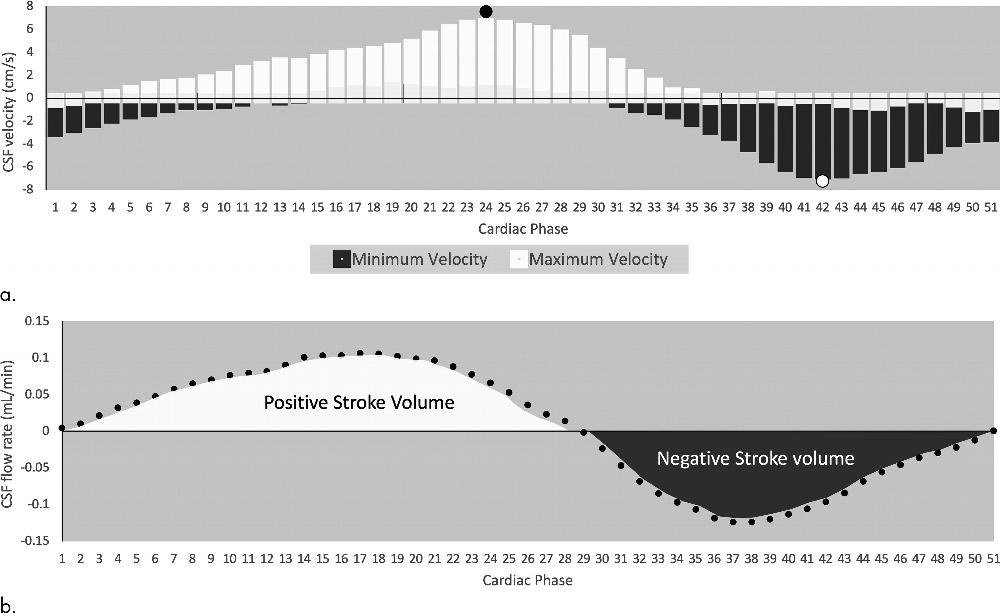
Figure 2. Graphs show (a) cerebrospinal fluid (CSF) peak-to-peak velocity magnitude and (b) aqueductal stroke volume derivation. The x-axis is one cardiac cycle divided into 51 cardiac phases. Start of systole is indicated by phase 1. (a) Bar graph represents the maximum (white bars) and minimum (black bars) velocities (y-axis) measured across the cross-sectional area of the cerebral aqueduct at each given phase of the cardiac cycle. CSF flow is bidirectional through the aqueduct over a single cardiac cycle. Peak-to-peak velocity magnitude is the peak maximum velocity (black circle) minus the peak minimum velocity (white circle). (b) Cerebral perfusion generates a pressure wave that induces CSF flow toward the fourth ventricle represented by negative aqueductal CSF flow rate. Integration of negative CSF flow rate is the negative stroke volume (black area). Positive aqueductal CSF flow rate indicates return flow toward the third and lateral ventricles. Integration of positive CSF flow rate is the positive stroke volume (white area). Aqueductal stroke volume is the positive stroke volume minus the negative stroke volume.
High-res (TIF) version
(Right-click and Save As)
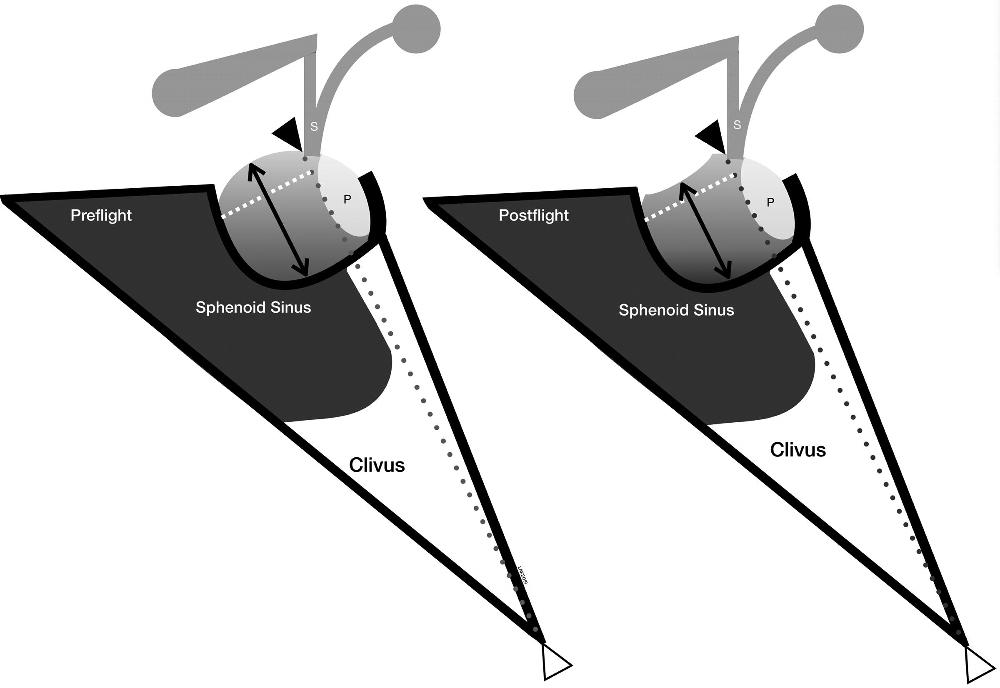
Figure 3. Illustration of the pituitary midline height quantitative measurement technique. A midplane orthogonal sagittal image through the pituitary stalk was reconstructed by using the three-dimensional T1-weighted sequence. The black arrowhead represents the anterior margin of the pituitary stalk (S) at the insertion of the pituitary gland. A reference line (gray dotted line) is then drawn to the tip of the clivus (white arrowhead). The tip of the clivus is used as a reliable fixed point between studies. A perpendicular line (white dashed line) is then drawn from the reference line to the anterior margin of the pituitary gland. The white dotted line was then bisected by a line parallel to the reference line (black double arrow) which was is used to measure the height between the superior and inferior margins of the pituitary at midgland. The preflight illustration on the left shows a normal upward convexity of the pituitary gland, whereas the postflight illustration on right shows the change in midgland height with acquired pituitary dome concavity. P = posterior pituitary gland.
High-res (TIF) version
(Right-click and Save As)
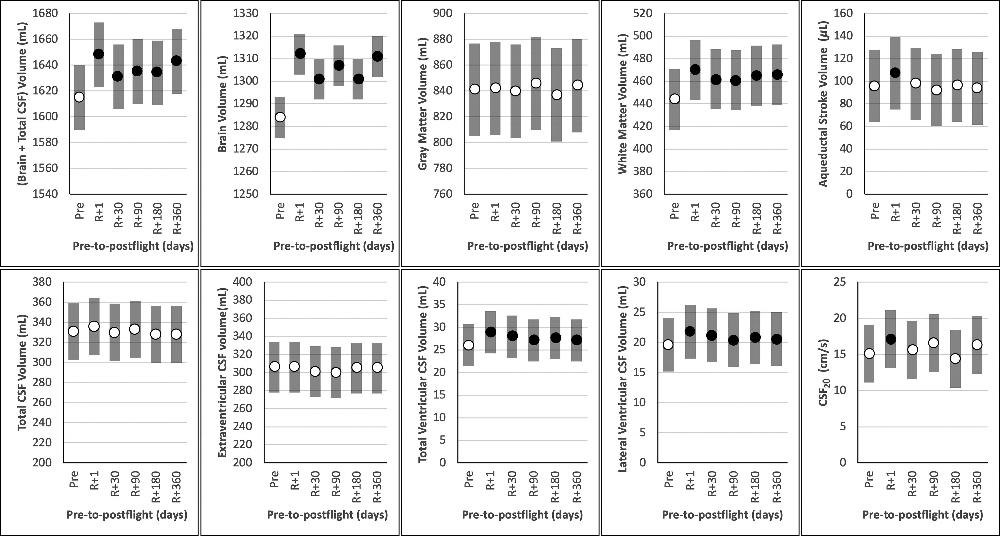
Figure 4. Longitudinal analysis of intracranial volumetry and cerebrospinal fluid (CSF) hydrodynamics. Preflight to five longitudinal postflight data are shown (x-axis). Shaded rectangles represent the 95% confidence intervals of the mean. Circles represent the model mean values by adjusting for preflight exposure to microgravity (ie, days of spaceflight). Filled circles indicate a statistically significant result from preflight baseline value by using a priori comparisons in our mixed-effects statistical analysis. Total CSF, extraventricular CSF, and gray matter volumes are relatively stable throughout the measurement periods. R+ = return after spaceflight.
High-res (TIF) version
(Right-click and Save As)
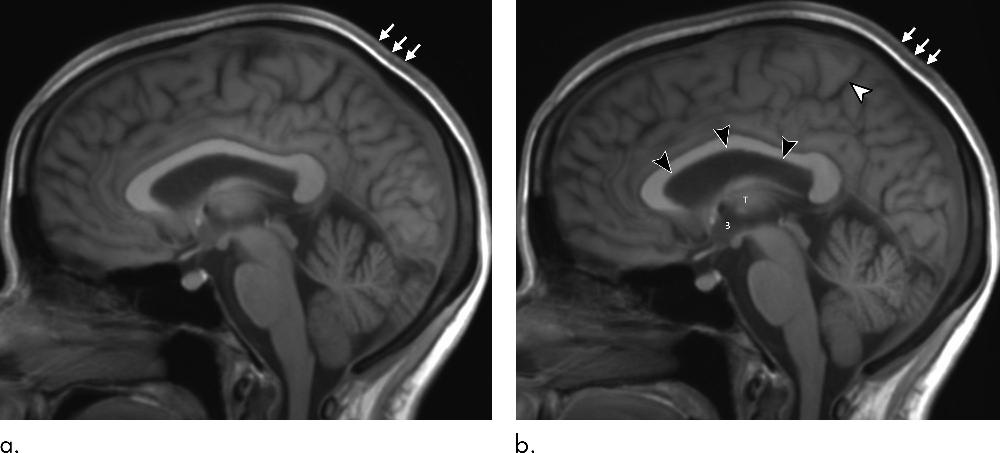
Figure 5. Reconstructed sagittal 5-mm orthogonal midline images in the brain using the sagittal three-dimensional T1 weighted data set. (a) Preflight baseline image and (b) matching postflight image (postflight day 1) in the same astronaut. The black arrowheads show upward expansion of the anterior, middle, and posterior superior margins of the lateral ventricle with associated narrowing of the marginal sulcus of the cingulate sulcus (white arrowhead). There is subtle expansion of the third ventricle (indicated by a 3), which has displaced the thalamus (T) from midline, making it less visible. There is thickening of the intermediate signal scalp soft tissues (arrows).
High-res (TIF) version
(Right-click and Save As)

Figure 6. Pituitary deformity examples in three crewmembers before spaceflight and after spaceflight (day 1). (a) Only the first crewmember shown in a had no previous exposure to spaceflight. Reconstructed orthogonal sagittal three-dimensional T1-weighted images in the pituitary gland centered at the pituitary stalk are shown for each crewmember. (a) Before flight there is normal upward convexity of the pituitary gland dome (black arrowhead) and a straight pituitary stalk (white arrowhead). In this astronaut, there is no change in the morphologic structure of the pituitary gland or stalk after spaceflight (pituitary deformity score, 0). The anterior pituitary gland (indicated by the a in a) and posterior pituitary gland (p) are indicated. (b) Before spaceflight there is normal upward convexity of the pituitary gland dome. After spaceflight there is flattening of the pituitary gland dome (pituitary deformity score, 1). Note the cerebrospinal fluid (CSF) within the suprasellar cistern immediately above the dome of the pituitary gland. (c) Before spaceflight there is mild concavity of the pituitary gland dome. After spaceflight there is moderate concavity of the pituitary gland dome with loss of volume and new subtle posterior deviation with slight curvature of the pituitary stalk (arrows; pituitary deformity score, 1). *Increased congestion of the sphenoid sinus after spaceflight is shown.
High-res (TIF) version
(Right-click and Save As)