CT Provides Best Diagnosis for COVID-19
Released: February 26, 2020
At A Glance
- In a study of 1,014 patients, chest CT was more effective than RT-PCR lab testing in detection of COVID-19.
- The results showed that 601 patients (59%) had positive RT-PCR results, while 888 (88%) had positive chest CT scans.
- The low sensitivity of RT-PCR implies that many COVID-19 patients may not receive appropriate treatment and risk infecting a larger population.
- RSNA Media Relations
1-630-590-7762
media@rsna.org - Linda Brooks
1-630-590-7738
lbrooks@rsna.org - Dionna Arnold
1-630-590-7791
darnold@rsna.org
OAK BROOK, Ill. (February 26, 2020) — In a study of more than 1,000 patients published in the journal Radiology, chest CT outperformed lab testing in the diagnosis of 2019 novel coronavirus disease (COVID-19). The researchers concluded that CT should be used as the primary screening tool for COVID-19.
In the absence of specific therapeutic drugs or vaccines for COVID-19, it is essential to detect the disease at an early stage and immediately isolate an infected patient from the healthy population.
According to the latest guidelines published by the Chinese government, the diagnosis of COVID-19 must be confirmed by reverse-transcription polymerase chain reaction (RT-PCR) or gene sequencing for respiratory or blood specimens, as the key indicator for hospitalization. However, with limitations of sample collection and transportation, as well as kit performance, the total positive rate of RT-PCR for throat swab samples has been reported to be about 30% to 60% at initial presentation.
In the current public health emergency, the low sensitivity of RT-PCR implies that a large number of COVID-19 patients won’t be identified quickly and may not receive appropriate treatment. In addition, given the highly contagious nature of the virus, they carry a risk of infecting a larger population.
“Early diagnosis of COVID-19 is crucial for disease treatment and control. Compared to RT-PCR, chest CT imaging may be a more reliable, practical and rapid method to diagnose and assess COVID-19, especially in the epidemic area,” the authors wrote.
Chest CT, a routine imaging tool for pneumonia diagnosis, is fast and relatively easy to perform. Recent research found that the sensitivity of CT for COVID-19 infection was 98% compared to RT-PCR sensitivity of 71%.
For the current study, researchers at Tongji Hospital in Wuhan, China, set out to investigate the diagnostic value and consistency of chest CT imaging in comparison to RT-PCR assay in COVID-19.
Included in the study were 1,014 patients who underwent both chest CT and RT-PCR tests between January 6 and February 6, 2020. With RT-PCR as reference standard, the performance of chest CT in diagnosing COVID-19 was assessed. For patients with multiple RT-PCR assays, the dynamic conversion of RT-PCR test results (negative to positive, and positive to negative, respectively) was also analyzed as compared with serial chest CT scans.
The results showed that 601 patients (59%) had positive RT-PCR results, and 888 (88%) had positive chest CT scans. The sensitivity of chest CT in suggesting COVID-19 was 97%, based on positive RT-PCR results. In patients with negative RT-PCR results, 75% (308 of 413 patients) had positive chest CT findings. Of these, 48% were considered as highly likely cases, with 33% as probable cases. By analysis of serial RT-PCR assays and CT scans, the interval between the initial negative to positive RT-PCR results was 4 to 8 days.
“About 81% of the patients with negative RT-PCR results but positive chest CT scans were re-classified as highly likely or probable cases with COVID-19, by the comprehensive analysis of clinical symptoms, typical CT manifestations and dynamic CT follow-ups,” the authors wrote.
Find all the latest Radiology and Radiology: Cardiothoracic Imaging COVID-19 research at Special Focus: COVID-19.
“Correlation of Chest CT and RT-PCR Testing in Coronavirus Disease 2019 (COVID-19) in China: A Report of 1014 Cases,” Tao Ai, M.D., Ph.D., Zhenlu Yang, M.D., Ph.D., Hongyan Hou, M.D., Chenao Zhan, M.D., Chong Chen, M.D., Wenzhi Lv, Qian Tao, Ph.D., Ziyong Sun, M.D., Liming Xia, M.D., Ph.D.
Radiology is edited by David A. Bluemke, M.D., Ph.D., University of Wisconsin School of Medicine and Public Health, Madison, Wis., and owned and published by the Radiological Society of North America, Inc. (https://pubs.rsna.org/journal/radiology)
RSNA is an association of radiologists, radiation oncologists, medical physicists and related scientists promoting excellence in patient care and health care delivery through education, research and technologic innovation. The Society is based in Oak Brook, Ill. (RSNA.org)
For patient-friendly information on chest CT, visit RadiologyInfo.org.
Images (JPG, TIF):

Figure 1. Flowchart of this study. RT-PCR= reverse transcription polymerase chain reaction.
High-res (TIF) version
(Right-click and Save As)
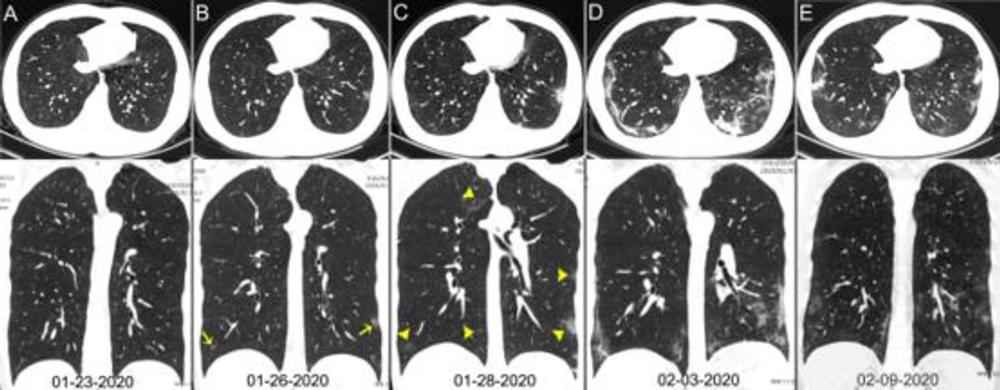
Figure 2. Chest CT images of a 29-year-old man with fever for 6 days. RT-PCR assay for the SARS-CoV-2 using a swab sample was performed on February 5, 2020, with a positive result. (A) Normal chest CT with axial and coronal planes was obtained at the onset. (B) Chest CT with axial and coronal planes shows minimal ground-glass opacities in the bilateral lower lung lobes (yellow arrows). (C) Chest CT with axial and coronal planes shows increased ground-glass opacities (yellow arrowheads). (D) Chest CT with axial and coronal planes shows the progression of pneumonia with mixed ground-glass opacities and linear opacities in the subpleural area. (E) Chest CT with axial and coronal planes shows the absorption of both ground-glass opacities and organizing pneumonia.
High-res (TIF) version
(Right-click and Save As)
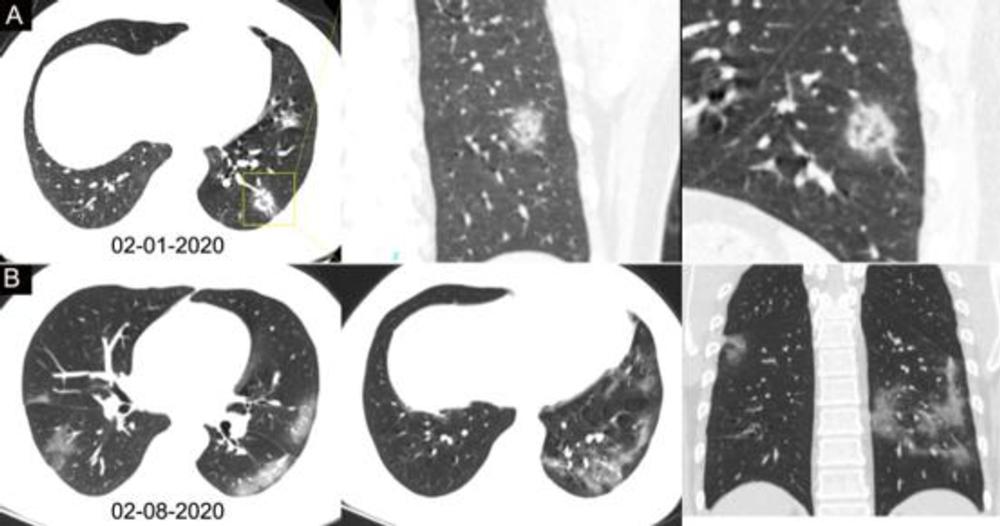
Figure 3. Chest CT images of a 34-year-old man with fever for 4 days. Positive result of RT-PCR assay for the SARS-CoV-2 using a swab sample was obtained on February 8, 2020. (A) Chest CT with lesion-magnified coronal and sagittal planes shows a nodule with reversed halo sign in the left lower lobe (yellow box) at the early stage of the pneumonia. (B) Chest CT with different axial planes and coronal reconstruction shows bilateral multifocal ground-glass opacities. The nodular opacity resolved.
High-res (TIF) version
(Right-click and Save As)
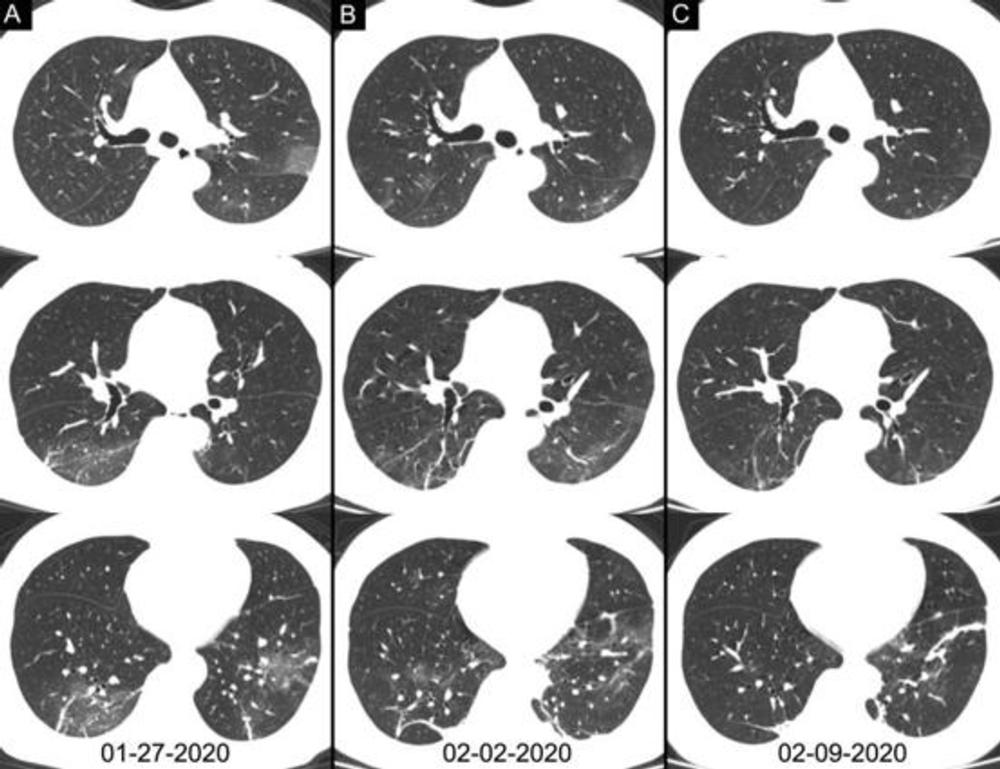
Figure 4. Chest CT images of a 46-year-old woman with fever for 4 days. The result of RT-PCR assay for the SARS-CoV-2 using a swab sample was positive on February 4, 2020 and was negative on February 12. Three chest CT scans obtained from (A) January 27, (B) February 2 and (C) February 09, 2020 show the gradual absorption of bilateral ground-glass opacities and linear consolidation.
High-res (TIF) version
(Right-click and Save As)
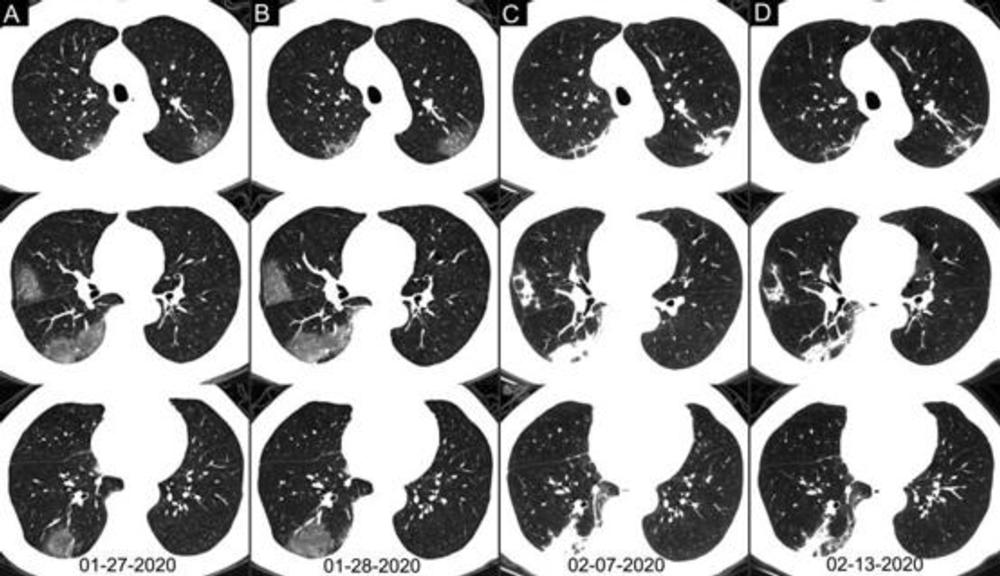
Figure 5. Chest CT images of a 62-year-old man with fever for 2 weeks, and dyspnea for 1 day. Negative results of RT-PCR assay for the SARS-CoV-2 using a swab samples were obtained on February 3 and 11, 2020, respectively. (A) Chest CT with multiple axial images shows multiple ground-glass opacities in the bilateral lungs. (B) Chest CT with multiple axial images shows enlarged multiple ground-glass opacities. (C) Chest CT with multiple axial images shows the progression of the disease from ground-glass opacities to multifocal organizing consolidation. (D) chest CT with multiple axial images shows partial absorption of the organizing consolidation.
High-res (TIF) version
(Right-click and Save As)
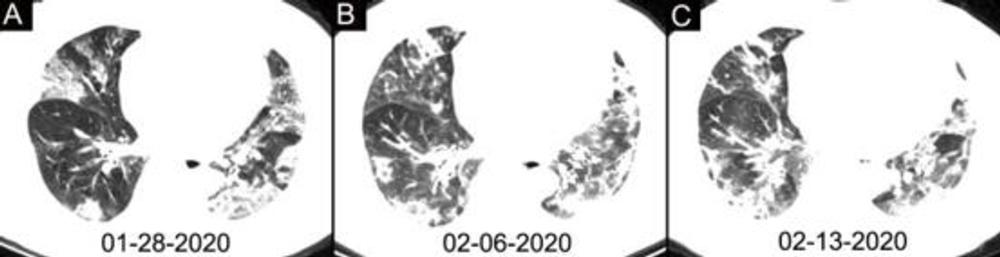
Figure 6. Chest CT images of a 63-year-old woman with fever for 11 days. Negative results of RT-PCR assay for the SARS-CoV-2 using a swab samples were obtained on February 2 and 11, 2020, respectively. (A-C) Chest CT scans show typical mixed ground-glass opacities and multifocal consolidation shadows in bilateral lungs without evidence of resolution without resolution over 16 days.
High-res (TIF) version
(Right-click and Save As)
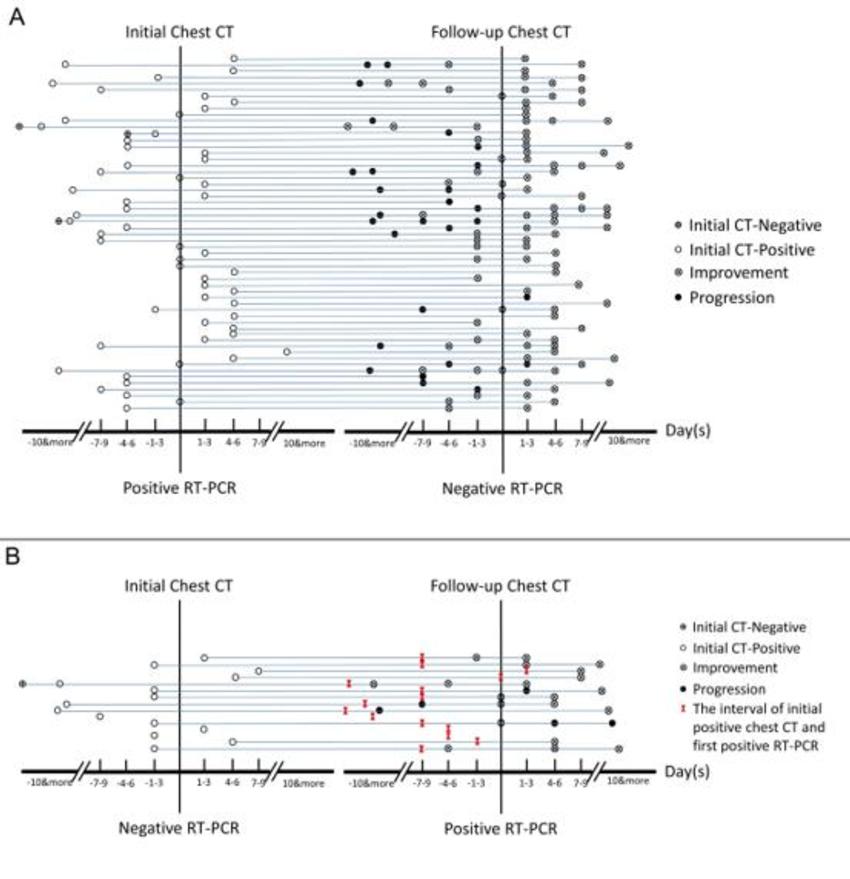
Figure 7. Analysis of serial RT-PCR assays in correlation with serial chest CT scans. (A) The subgroup of positive to negative RT-PCR results (n = 57). (B) The subgroup of negative to positive RT-PCR results (n = 15). The horizontal axis is the time point of initial chest CT and follow-up chest CT scans relative to the time point of the consecutive two RT-PCR tests (before positive RT-PCR, negative numbers; after RT-PCR, positive numbers).
High-res (TIF) version
(Right-click and Save As)