AI Improves Chest X-ray Interpretation
Released: December 03, 2019
At A Glance
- Researchers trained deep learning artificial intelligence models to interpret chest X-rays.
- The models performed on par with radiologists in detecting fractures, nodules or masses, opacity and pneumothorax.
- Two large datasets were used to develop, train and test the models. The first dataset consisted of more than 750,000 images from five hospitals in India, while the second set included 112,120 images made publicly available by the National Institutes of Health.
- RSNA Media Relations
1-630-590-7762
media@rsna.org - Linda Brooks
1-630-590-7738
lbrooks@rsna.org - Dionna Arnold
1-630-590-7791
darnold@rsna.org
OAK BROOK, Ill. — A sophisticated type of artificial intelligence (AI) can detect clinically meaningful chest X-ray findings as effectively as experienced radiologists, according to a study published in the journal Radiology. Researchers said their findings, based on a type of AI called deep learning, could provide a valuable resource for the future development of AI chest radiography models.
Chest radiography, or X-ray, one of the most common imaging exams worldwide, is performed to help diagnose the source of symptoms like cough, fever and pain. Despite its popularity, the exam has limitations.

"We've found that there is a lot of subjectivity in chest X-ray interpretation," said study co-author Shravya Shetty, an engineering lead at Google Health in Palo Alto, California. "Significant inter-reader variability and suboptimal sensitivity for the detection of important clinical findings can limit its effectiveness."
Deep learning, a sophisticated type of AI in which the computer can be trained to recognize subtle patterns, has the potential to improve chest X-ray interpretation, but it too has limitations. For instance, results derived from one group of patients cannot always be generalized to the population at large.
Researchers at Google Health developed deep learning models for chest X-ray interpretation that overcome some of these limitations. They used two large datasets to develop, train and test the models. The first dataset consisted of more than 750,000 images from five hospitals in India, while the second set included 112,120 images made publicly available by the National Institutes of Health (NIH).
A panel of radiologists convened to create the reference standards for certain abnormalities visible on chest X-rays used to train the models.
"Chest X-ray interpretation is often a qualitative assessment, which is problematic from deep learning standpoint," said Daniel Tse, M.D., product manager at Google Health. "By using a large, diverse set of chest X-ray data and panel-based adjudication, we were able to produce more reliable evaluation for the models."
Tests of the deep learning models showed that they performed on par with radiologists in detecting four findings on frontal chest X-rays, including fractures, nodules or masses, opacity (an abnormal appearance on X-rays often indicative of disease) and pneumothorax (the presence of air or gas in the cavity between the lungs and the chest wall).
Radiologist adjudication led to increased expert consensus of the labels used for model tuning and performance evaluation. The overall consensus increased from just over 41 percent after the initial read to more than almost 97 percent after adjudication.
The rigorous model evaluation techniques have advantages over existing methods, researchers said. By beginning with a broad, hospital-based clinical image set, and then sampling a diverse set of cases and reporting population adjusted metrics, the results are more representative and comparable. Additionally, radiologist adjudication provides a reference standard that can be both more sensitive and more consistent than other methods.
"We believe the data sampling used in this work helps to more accurately represent the incidence for these conditions," Dr. Tse said. "Moving forward, deep learning can provide a useful resource to facilitate the continued development of clinically useful AI models for chest radiography."
The research team has made the expert-adjudicated labels for thousands of NIH images available for use by other researchers at the following link: https://cloud.google.com/healthcare/docs/resources/public-datasets/nih-chest#additional_labels.
"The NIH database is a very important resource, but the current labels are noisy, and this makes it hard to interpret the results published on this data," Shetty said. "We hope that the release of our labels will help further research in this field."
"Chest Radiograph Interpretation with Deep Learning Models: Assessment with Radiologist-adjudicated Reference Standards and Population-adjusted Evaluation." Collaborating with Shetty and Dr. Tse were Anna Majkowska, Ph.D., Sid Mittal, B.S., David F. Steiner, M.D., Ph.D., Joshua J. Reicher, M.D., Scott Mayer McKinney, M.S., Gavin E. Duggan, Ph.D., Krish Eswaran, Ph.D., Po-Hsuan Cameron Chen, Ph.D., Yun Liu, Ph.D., Sreenivasa Raju Kalidindi, M.B.B.S., Alexander Ding, M.D., M.S., and Greg S. Corrado, Ph.D.
Radiology is edited by David A. Bluemke, M.D., Ph.D., University of Wisconsin School of Medicine and Public Health, Madison, Wis., and owned and published by the Radiological Society of North America, Inc. (http://radiology.rsna.org/)
RSNA is an association of over 53,400 radiologists, radiation oncologists, medical physicists and related scientists, promoting excellence in patient care and health care delivery through education, research and technologic innovation. The Society is based in Oak Brook, Ill. (RSNA.org)
For patient-friendly information on chest X-rays, visit RadiologyInfo.org.
Images (.JPG and .TIF format)
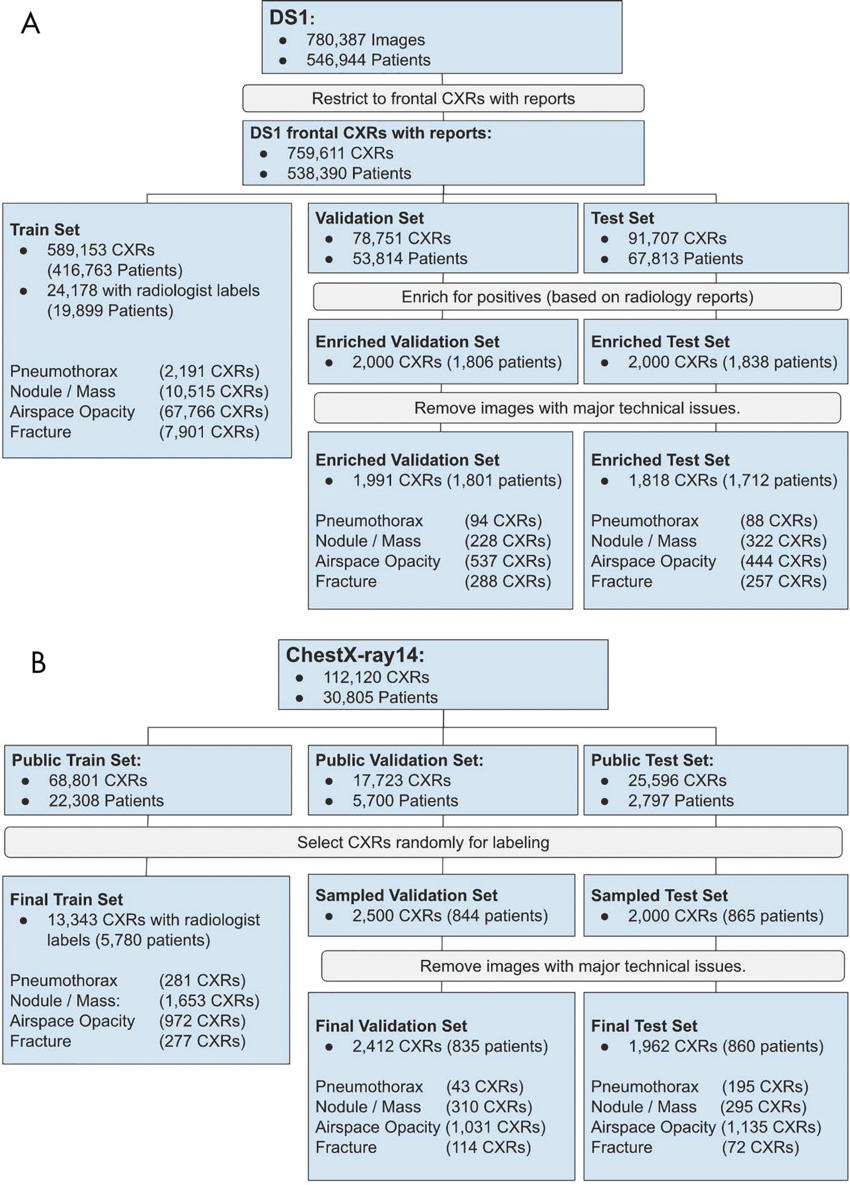
Figure 1. Flowchart of images used from, A, data set 1 (DS1) and, B, ChestX-ray14 data set. The final validation and test sets do not include images found to have technical issues (such as markings or poor image quality) or incomplete baseline reviews. CXR = chest radiograph.
High-res (TIF) version
(Right-click and Save As)
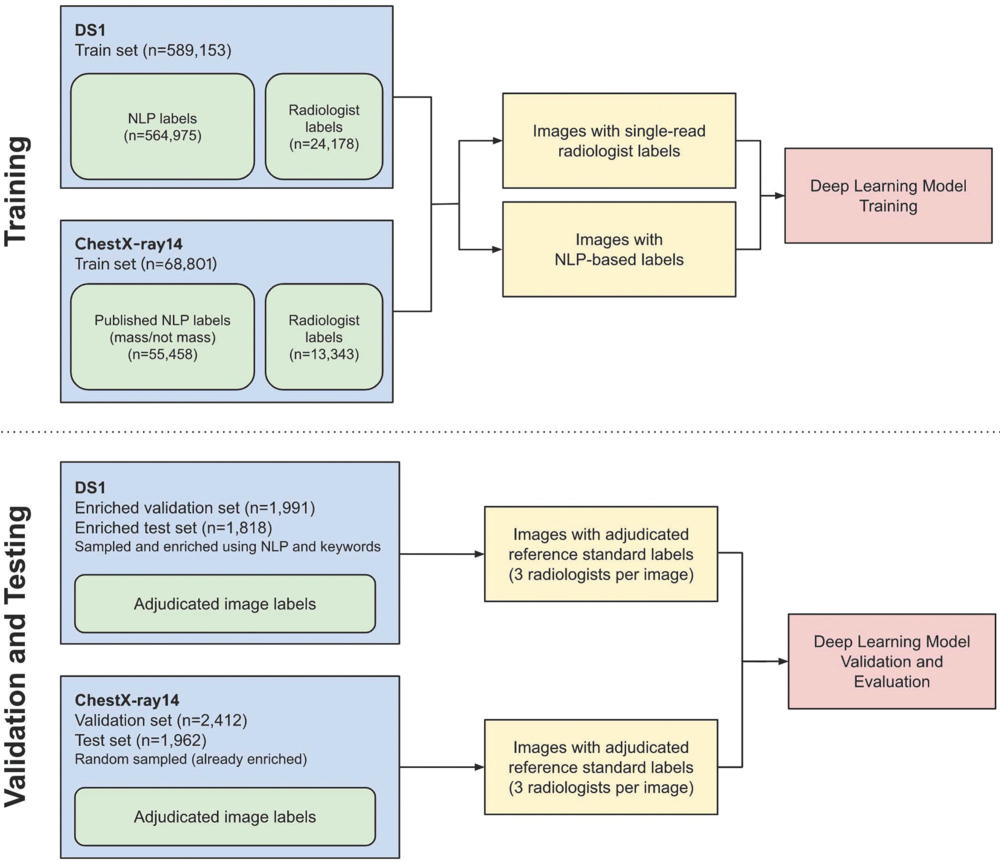
Figure 2. Schematic of labeling strategy used for training and validation and testing in the deep learning models. Training labels were provided by a mix of radiologist image interpretations and natural language processing (NLP) to maximize both high-quality and high-quantity training data. Test set labels were on the basis of adjudicated labels from a panel of three board-certified radiologists per image. Validation set labels were also adjudicated by a panel of three readers, including residents and radiologists. DS1 = data set 1.
High-res (TIF) version
(Right-click and Save As)
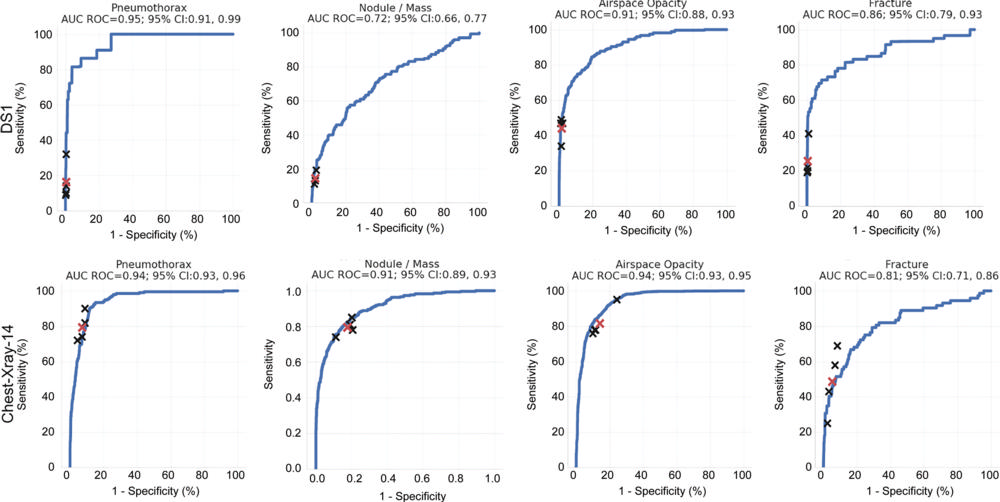
Figure 3. Receiver operating characteristic (ROC) curves of performance evaluation. Performance of the model (blue curves) and individual radiologists (black crosses) across the four findings on the test sets of data set 1 (DS1) and ChestX-ray14. The average reader performance is indicated by red crosses. For DS1, the ROC curves and individual reader operating points represent population-adjusted analysis. AUC = area under the curve, CI = confidence interval.
High-res (TIF) version
(Right-click and Save As)
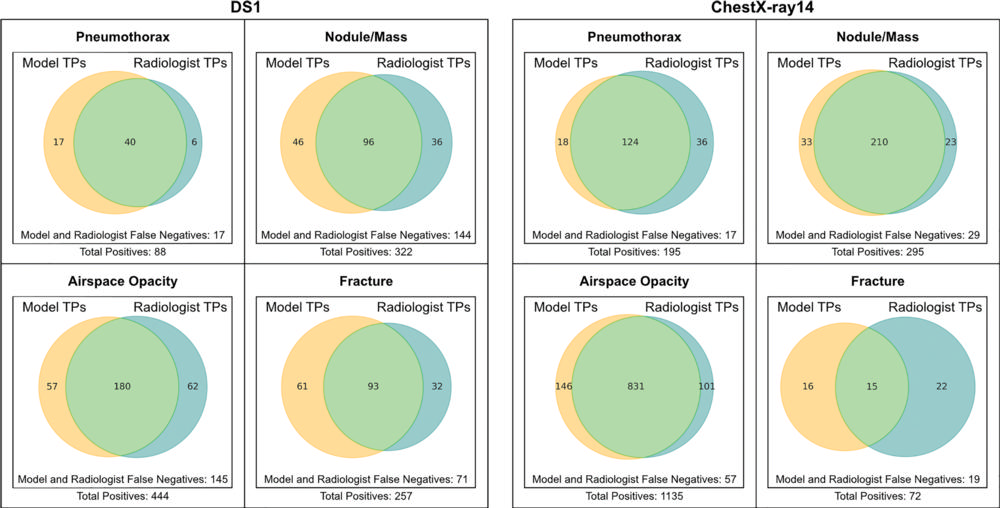
Figure 4. Venn diagrams show comparison of true positives identified by deep learning models and radiologists. For each image, one of the four radiologists' responses was selected randomly to approximate an average response across readers. Data represent comparison of all images with true-positive classifications by the model (yellow) or the radiologist (blue). Nonoverlapping regions thus represent true-positive findings identified by only the radiologists or only the models. DS1 = data set 1, TP = true positive.
High-res (TIF) version
(Right-click and Save As)
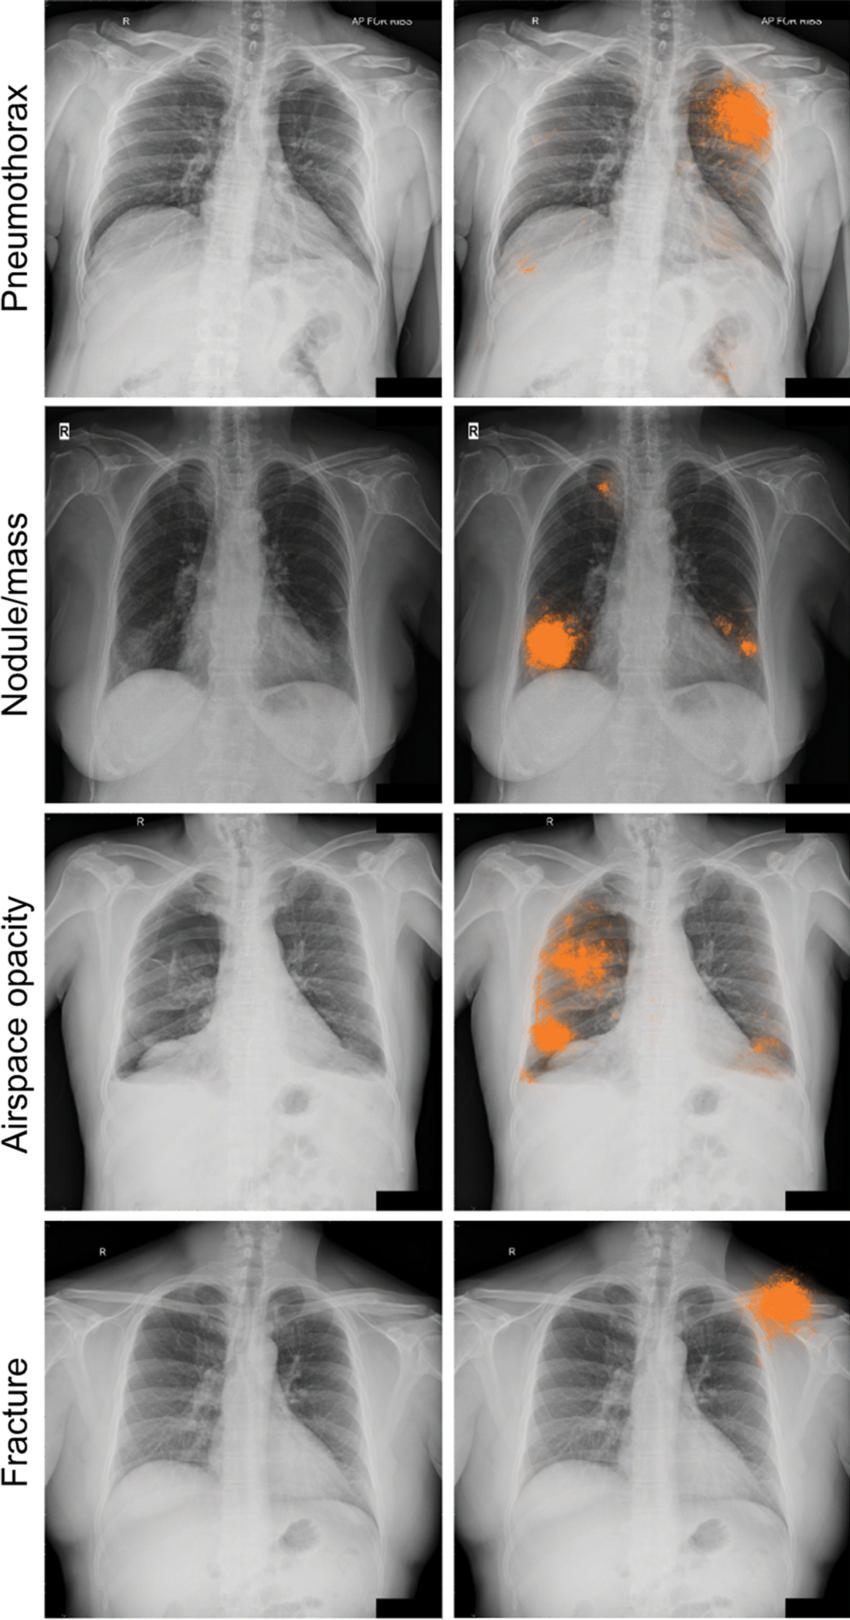
Figure 5a. Radiographic images with discordant interpretations between deep learning models and radiologists. (a) Examples for the four classes of abnormality (pneumothorax, nodule or mass, airspace opacity, and fracture) classified correctly by the deep learning model (ie, concordant with the adjudicated reference standard), but not identified by any of the four radiologists in the performance comparison cohort. The highlighted areas (orange) indicate the regions with the greatest influence on image-level model predictions, as identified by using SmoothGrad (29).
High-res (TIF) version
(Right-click and Save As)
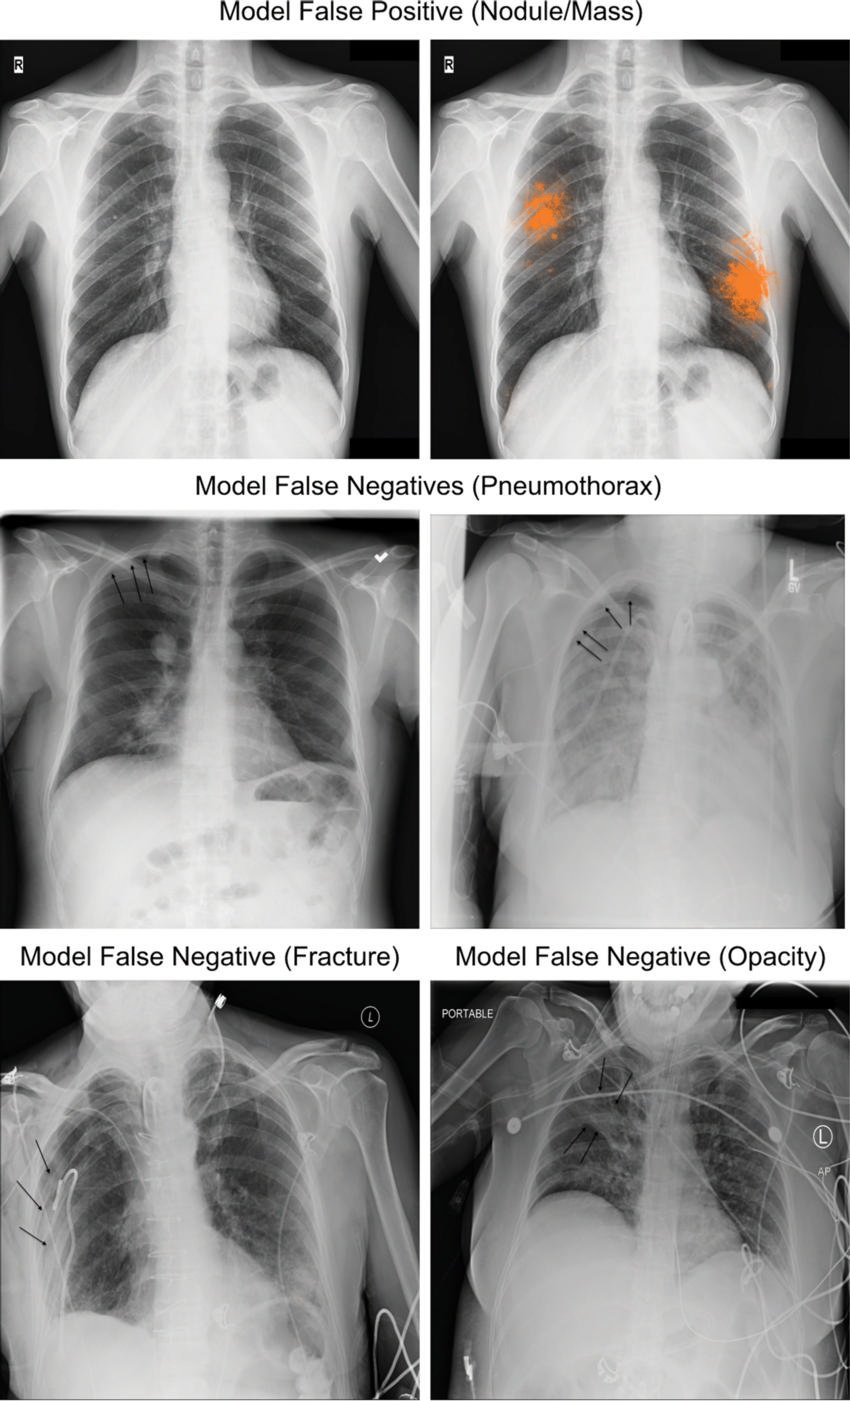
Figure 5b. Examples for the four classes of abnormality incorrectly classified by the deep learning model (ie, model discordant with the adjudicated reference standard), and correctly classified by at least 2 radiologists in the performance comparison cohort. Top, an example of a granuloma that was classified incorrectly by our model as a nodule. Middle and bottom, additional findings not identified by the model at the threshold corresponding to average radiologist specificity. Black arrows indicate the finding of interest for each radiograph.
High-res (TIF) version
(Right-click and Save As)