Brain Iron Levels May Predict Multiple Sclerosis Disabilities
Released: July 17, 2018
At A Glance
- Researchers used an MRI technique called quantitative susceptibility mapping to measure brain iron levels in MS patients.
- The technique was performed on 600 MS patients—452 with early-stage disease and 148 whose disease had progressed.
- Compared with the control group, MS patients had higher levels of iron in the basal ganglia and lower levels of iron in the thalamus.
- RSNA Media Relations
1-630-590-7762
media@rsna.org - Linda Brooks
1-630-590-7738
lbrooks@rsna.org - Dionna Arnold
1-630-590-7791
darnold@rsna.org
OAK BROOK, Ill. — A new, highly accurate MRI technique can monitor iron levels in the brains of multiple sclerosis (MS) patients and help identify those at a higher risk for developing physical disability, according to a study published in the journal Radiology.
MS is a disease that attacks three critical components of the central nervous system: the neurons (nerve fibers), myelin (the protective sheath around the neurons), and the cells that produce myelin. Common symptoms of MS include weakness, spasticity and pain. The disease can progress in many patients, leaving them severely disabled. Brain atrophy is the current gold standard for predicting cognitive and physical decline in MS, but it has limitations, said study lead author Robert Zivadinov, M.D., Ph.D., professor of neurology at the Jacobs School of Medicine and Biomedical Sciences at the University at Buffalo (UB) in Buffalo, N.Y. He is director of the Buffalo Neuroimaging Analysis Center in the Jacobs School and the Center for Biomedical Imaging at UB’s Clinical and Translational Science Institute.

“Brain atrophy takes a long time to see,” he said. “We need an earlier measure of who will develop MS-related disability.”
MRI studies of iron concentration have emerged recently as a promising measure of changes in the brain associated with MS progression. Iron is vital for various cellular functions in the brain, including myelination of neurons, and both iron overload and iron deficiencies can be harmful.
“It is known that there is more iron in the deep gray matter structures in MS patients, but also we’ve seen in recent literature that there are regions where we find less iron in the brains of these patients,” Dr. Zivadinov said.
Dr. Zivadinov and colleagues recently compared brain iron levels in people with MS to those of a healthy control group using an advanced MRI technique called quantitative susceptibility mapping. A brain region with more iron would have higher magnetic susceptibility, and one with less iron would have lower susceptibility.
The researchers performed the mapping technique on 600 MS patients, including 452 with early-stage disease and 148 whose disease had progressed.
Compared to 250 healthy control participants, MS patients had higher levels of iron in the basal ganglia, a group of structures deep in the brain that are central to movement. However, the MS patients had lower levels of iron in their thalamus, an important brain region that helps process sensory input by acting as a relay between certain brain structures and the spinal cord. The lower iron content in the thalamus and higher iron content in other deep gray matter structures of people with MS were associated with longer disease duration, higher disability degree and disease progression.
This association with clinical disability persisted even after adjusting for changes in the brain volumes of each individual structure.
“In this large cohort of MS patients and healthy controls, we have reported, for the first time, iron increasing in the basal ganglia but decreasing in thalamic structures,” Dr. Zivadinov said. “Iron depletion or increase in several structures of the brain is an independent predictor of disability related to MS.”
The results point to a potential role for quantitative susceptibility mapping in clinical trials of promising new drugs, Dr. Zivadinov said. Current treatments involving anti-inflammatory drugs do not prevent MS patients from developing disability.
“Susceptibility is an interesting imaging marker of disease severity that can predict which patients are at severe risk of progressing,” Dr. Zivadinov said. “To be able to act against changes in susceptibility would be extremely beneficial.”
Brain Iron by Using Quantitative MRI Is Associated with Disability in Multiple Sclerosis.” Collaborating with Dr. Zivadinov were Eleonora Tavazzi, M.D., Niels Bergsland, Ph.D., Jesper Hagemeier, Ph.D., Fuchun Lin, Ph.D., Michael G. Dwyer, Ph.D., Ellen Carl, Ph.D., Channa Kolb, M.D., David Hojnacki, M.D., Deepa Ramasamy, M.D., Jacqueline Durfee, B.S., Bianca Weinstock-Guttman, M.D., and Ferdinand Schweser, Ph.D.
Radiology is edited by David A. Bluemke, M.D., Ph.D., University of Wisconsin School of Medicine and Public Health, Madison, Wis., and owned and published by the Radiological Society of North America, Inc. (http://radiology.rsna.org/)
RSNA is an association of over 54,200 radiologists, radiation oncologists, medical physicists and related scientists, promoting excellence in patient care and health care delivery through education, research and technologic innovation. The Society is based in Oak Brook, Ill. (RSNA.org)
For patient-friendly information on brain MRI, visit RadiologyInfo.org.
Editorial:
Mapping Deep Gray Matter Iron in Multiple Sclerosis by Using Quantitative Magnetic Susceptibility
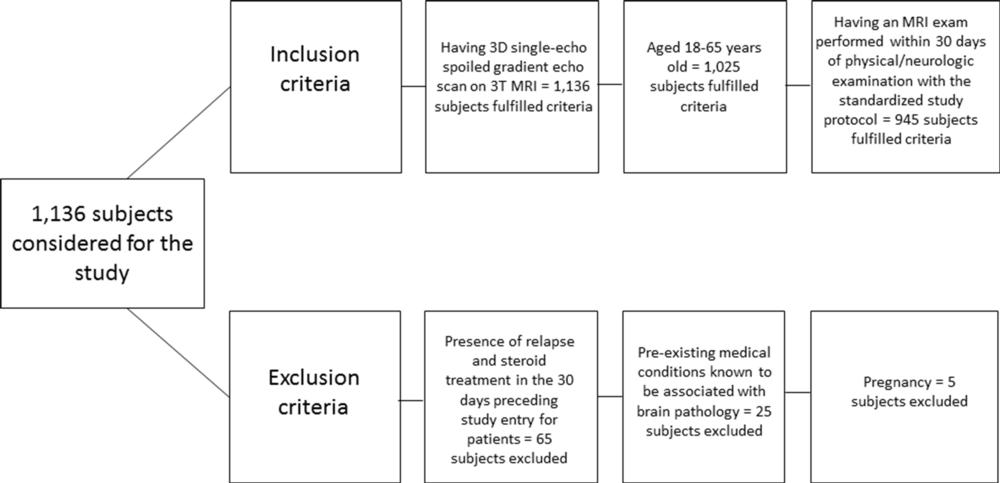
Figure 1. Flowchart shows inclusion and exclusion criteria.
High-res (TIF) version
(Right-click and Save As)
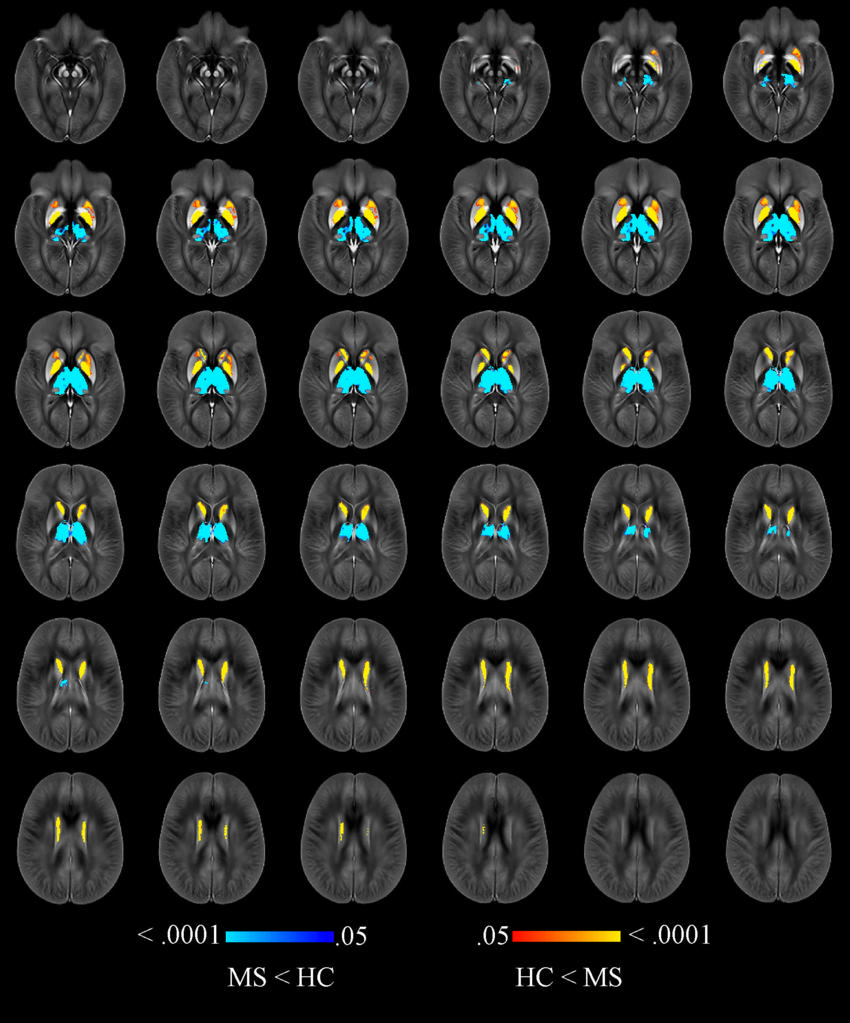
Figure 2. Image shows voxelwise analysis of quantitative susceptibility maps within thalamus, caudate, globus pallidus, and putamen comparing all participants with multiple sclerosis (MS) to healthy control (HC) participants. Areas of higher susceptibility in participants with MS compared with HC participants are shown in red-yellow. Areas of lower susceptibility in participants with MS compared with HC participants are shown in blue-light blue.
High-res (TIF) version
(Right-click and Save As)
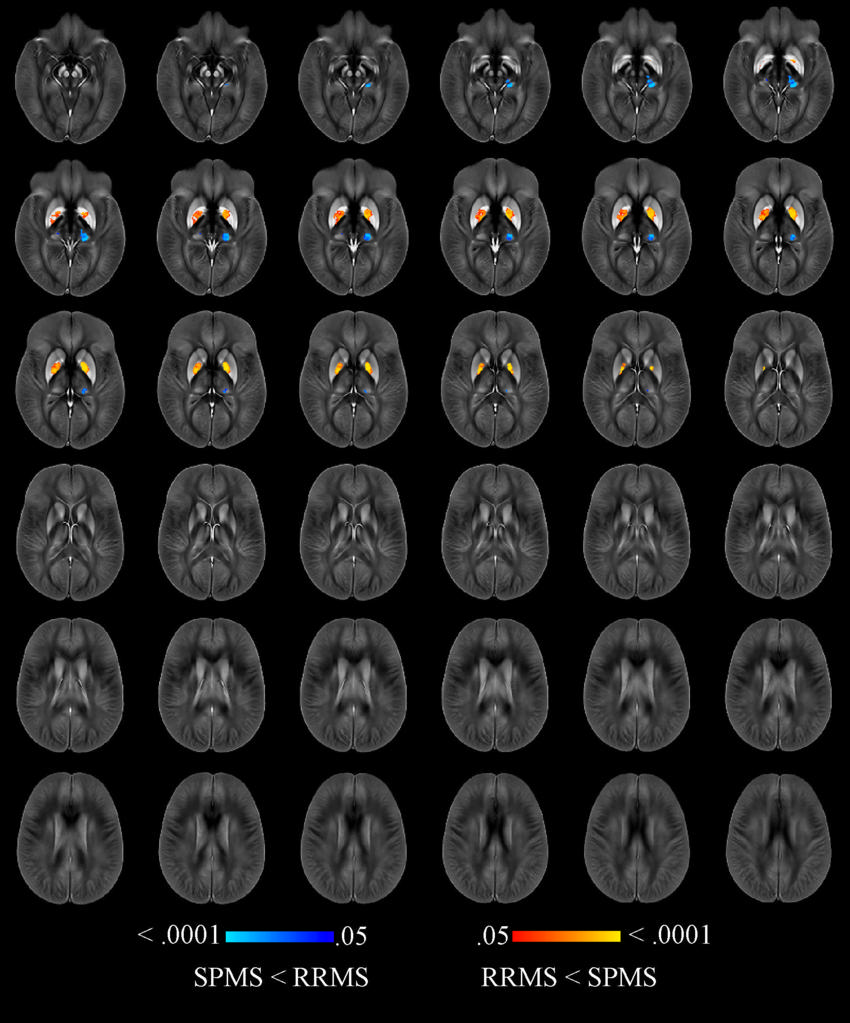
Figure 3. Image shows voxelwise analysis of quantitative susceptibility maps within thalamus, caudate, globus pallidus, and putamen comparing participants with secondary progressive (SP) multiple sclerosis (MS) with participants with relapsing-remitting (RR) MS. Areas of higher susceptibility in participants with SPMS compared with participants with RRMS are shown in red-yellow. Areas of lower susceptibility in participants with SPMS compared with participants with RRMS are shown in blue-light blue.
High-res (TIF) version
(Right-click and Save As)

Figure 4. Image shows voxelwise analysis of quantitative susceptibility maps within thalamus, caudate, globus pallidus, and putamen showing association with Expanded Disability Status Scale (EDSS), correcting for age, sex, and individual structural volumes in whole population with multiple sclerosis. Areas of higher susceptibility associated with higher EDSS are shown in red-yellow. Areas of lower susceptibility associated with higher EDSS are shown in blue-light blue.
High-res (TIF) version
(Right-click and Save As)
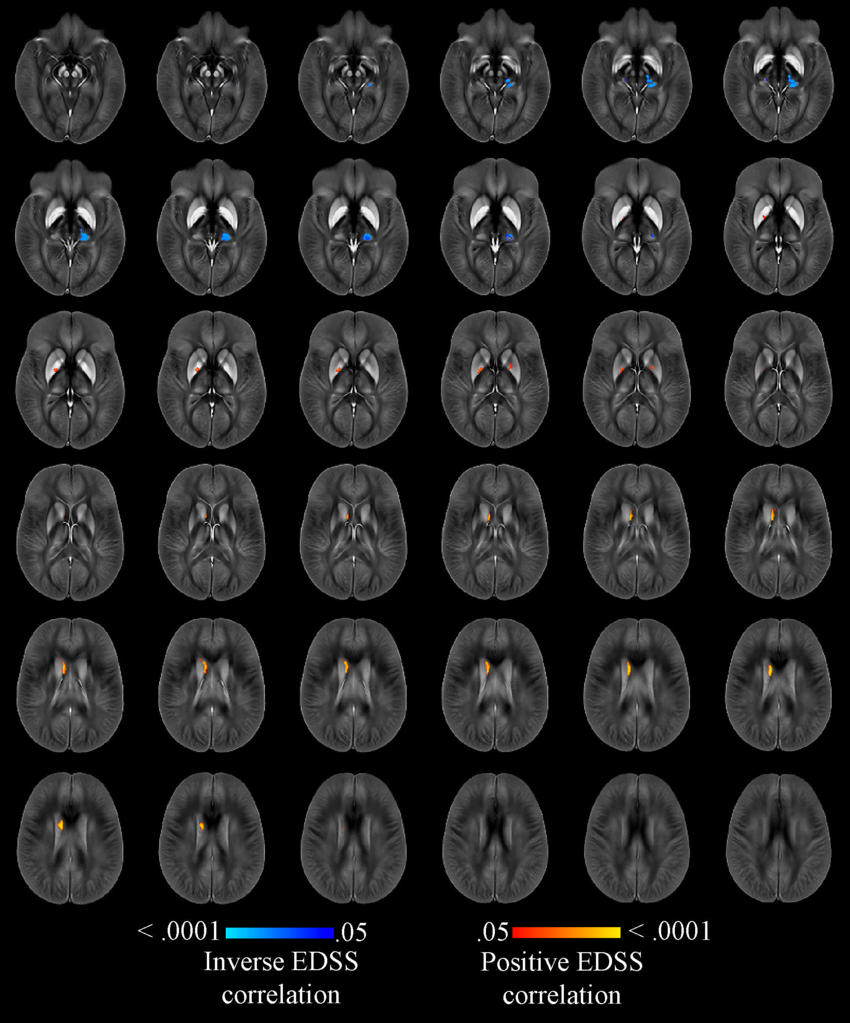
Figure 5. Image shows voxelwise analysis of quantitative susceptibility maps within thalamus, caudate, globus pallidus, and putamen showing association with Expanded Disability Status Scale (EDSS), correcting for age, sex, individual structural volume, whole brain volume, and T2 lesion volume in whole population with multiple sclerosis. Areas of higher susceptibility associated with higher EDSS are shown in red-yellow. Areas of lower susceptibility associated with higher EDSS are shown in blue-light blue.
High-res (TIF) version
(Right-click and Save As)