Fewer Recalls Associated with Higher Rates of Interval Breast Cancers
Released: April 03, 2018
At A Glance
- Lower screening mammography recall rates are associated with higher rates of interval cancers.
- Researchers analyzed 5,126,689 screening episodes from 84 screening facilities in the U.K. National Health Service Breast Screening Program.
- Recall rate averaged 4.56 percent, with an interval cancer rate of 3.1 per 1,000 women screened.
- RSNA Media Relations
1-630-590-7762
media@rsna.org - Linda Brooks
1-630-590-7738
lbrooks@rsna.org - Dionna Arnold
1-630-590-7791
darnold@rsna.org

OAK BROOK, Ill. – Lower screening mammography recall rates — the rates at which women are called back for additional testing based on suspicious findings — are associated with higher rates of breast cancers detected between screenings, or interval cancers, according to a major new study published online in the journal Radiology. Researchers said the study shows that establishing a minimum recall rate is a reasonable and potentially important goal for breast cancer screening programs.
Recall for additional testing after mammography is an important safeguard against missing invasive breast cancers, but the practice carries costs, including anxiety for the patient and additional expenses to the healthcare system. In order to minimize these costs, breast cancer screening programs routinely specify maximum recall rates after screening mammography.
The U.K. has established a maximum recall rate target of less than 7 percent for a patient’s first screening, also known as a prevalent screen, and less than 5 percent for incident screens, or those in which previous screening results exist. However, no such consensus exists as to a minimum recall rate, below which additional cancers would be missed.

To learn more about the potential trade-offs between lower recall rates and interval cancers, Elizabeth S. Burnside, M.D., MPH, from the University of Wisconsin School of Medicine and Public Health in Madison, Wis., and Stephen W. Duffy, B.Sc., M.Sc., from Queen Mary University of London, and colleagues analyzed 5,126,689 screening episodes, or the period during which a set of breast screening activities for an eligible woman takes place, from 84 screening facilities in the U.K. National Health Service Breast Screening Program (NHSBSP). Data were drawn from a 36-month period with a three-year follow-up in women ages 50 to 70 years.
Recall rate averaged 4.56 percent, with an interval cancer rate of 3.1 per 1,000 women screened. Interval cancers are associated with a worse prognosis than screen-detected cancers.
Lower recall rates correlated with higher interval cancer rates. The researchers estimated that, in aggregate, 80 to 84 additional recalls would be required to avoid one interval cancer, a ratio that varied based on age group and prevalent screens versus incident screens.
Screening mammography outcomes based on age demonstrated that both cancer detection rates and interval cancer rates were lower in younger age groups as expected, based on underlying breast cancer incidence according to age.
“Recall rate had more of an impact on interval cancer in patients who are older,” Dr. Burnside said. “The lower number of recalls required per interval cancer avoided in older women and incident screens as compared to younger women and prevalent screens, respectively, demonstrates a slightly different ‘value’ in terms of the trade-off between recall rate and interval cancers.”
The study provides evidence, Dr. Burnside said, of the potential importance of establishing and enforcing a lower threshold for recall rate.
While the study focused on the U.K. NHSBSP alone, Dr. Burnside pointed out that the methods used provide a basis for other programs to determine a minimal recall rate threshold that maximizes value for women undergoing breast cancer screening.
The study also underscores the crucial importance of comprehensive, accurate data collection of interval cancers in screening programs like the system in the U.K.
“A big-picture lesson in our study is the power of rigorous quality assurance infrastructure to help breast cancer screening programs learn from actual practice and use that information to make informed programmatic decisions for the future,” Dr. Burnside said. “This study documents the benefit of carefully tracking mammography use and outcomes as achieved in the NHSBSP.”
Additional research will help determine a specific minimum threshold for recall rate and assess the impact of digital mammography on the relationship between recall rate and interval cancers.
“Association between Screening Mammography Recall Rate and Interval Cancers in the UK Breast Cancer Service Screening Program: A Cohort Study” Collaborating with Drs. Burnside and Duffy were Daniel Vulkan, M.Sc., and Roger G. Blanks, Ph.D.
Radiology is edited by David A. Bluemke, M.D., Ph.D., University of Wisconsin School of Medicine and Public Health, Madison, Wis., and owned and published by the Radiological Society of North America, Inc. (http://radiology.rsna.org/)
RSNA is an association of over 54,200 radiologists, radiation oncologists, medical physicists and related scientists, promoting excellence in patient care and health care delivery through education, research and technologic innovation. The Society is based in Oak Brook, Ill. (RSNA.org)
For patient-friendly information on mammography, visit RadiologyInfo.org.
BURNSIDE CAPTIONS

Figure 1. Plots demonstrate association between recall to assessment rate and (a) interval cancer rate and (b) screening cancer detection rate. Points represent a year of screening mammograms in one of the 84 breast screening units. Line represents Poisson regression line.
High-res (TIF)
(Right-click and Save As)

Figure 2. Plots illustrate statistically significant association between recall to assessment rate and interval cancer rate for age-based subgroup analysis of women aged (a) 50–54 years, (b) 60–64 years, and (c) 65–69 years. Points represent a year of screening mammograms in one of the 84 breast screening units. Line represents Poisson regression line. Trade-off between an interval cancer and a recall is noted on each graph.
High-res (TIF)
(Right-click and Save As)
Images (.JPG and .TIF format)
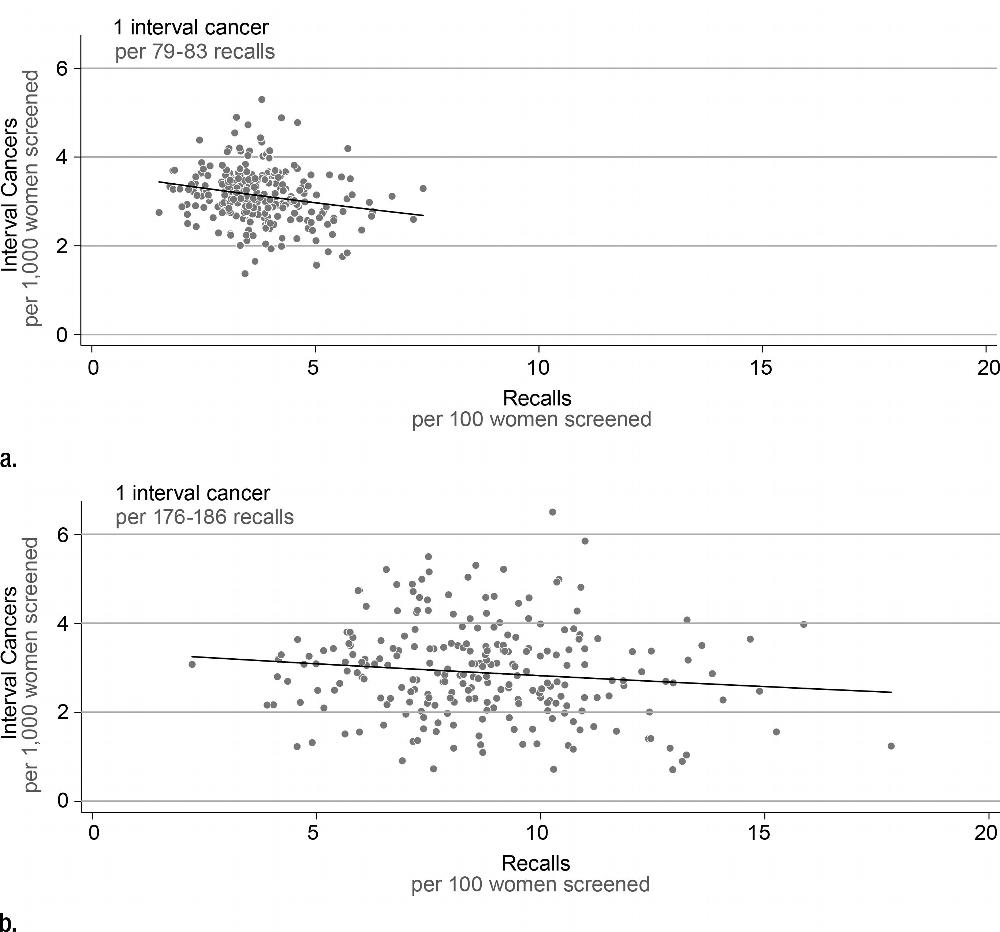
Figure 3. Plots illustrate statistically significant association between recall to assessment rate and interval cancer rate for (a) incident and (b) prevalent subgroup analysis. Points represent a year of screening mammograms in one of the 84 breast screening units. Line represents Poisson regression line. Trade-off between an interval cancer and a recall is noted on each graph.
High-res (TIF) version
(Right-click and Save As)
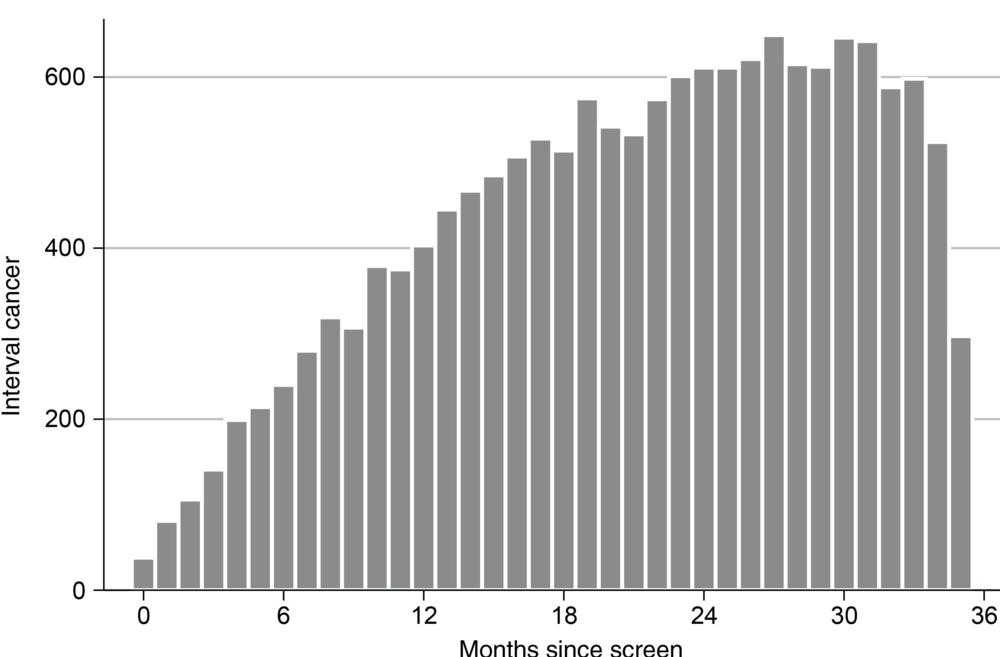
Figure 4. Bar graph shows number of interval cancers according to number of months since negative screening mammogram.
High-res (TIF) version
(Right-click and Save As)