MRI May Help Predict Cognitive Impairment in Professional Fighters
Released: July 25, 2017
At A Glance
- MRI techniques can help identify and track cognitive impairment in professional fighters.
- The study revealed a set of seven brain imaging predictors, including regions of gray matter and white matter, which were associated with cognitive function in fighters.
- Results showed gray matter volume and thickness measures along with white matter tract integrity declined over time with repeated trauma.
- RSNA Media Relations
1-630-590-7762
media@rsna.org - Linda Brooks
1-630-590-7738
lbrooks@rsna.org
OAK BROOK, Ill. – Images of the brain’s gray and white matter obtained with multiple MRI techniques can help identify and track cognitive impairment in active professional fighters, according to a new study published online in the journal Radiology.

Fighters are exposed to repeated mild traumatic brain injury (mTBI), which has been associated with neurodegenerative disorders, as well as mood and movement dysfunction. A tool that could find signs, or biomarkers, of mTBI-related brain damage would be an invaluable asset in helping fighters and their physicians understand their risk of cognitive impairment while potentially speeding interventions and contributing to the study and development of drugs designed to slow or reverse cognitive decline.
Much of previous research on the subject has focused on either the brain’s neuron-containing gray matter or the fiber tracts in the white matter. For this new study, researchers combined two MRI techniques — T1-weighted MRI and diffusion-tensor imaging (DTI) derived from diffusion weighted MRI — to look at both types of brain tissue.
“DTI is specific to the white matter part of the brain and T1-weighted images are sensitive to the gray matter,” said study lead author Virendra Mishra, Ph.D., from the Cleveland Clinic Lou Ruvo Center for Brain Health in Las Vegas. “By combining these approaches, we hoped to find imaging biomarkers on MRI that could be used to predict whether or not fighters will become impaired.”
The researchers used data from the Professional Fighters Brain Health Study, one of the largest longitudinal studies of brain health in contact sports. Data included 273 male fighters who had baseline imaging exams and 56 who returned for a follow-up scan. Using neuropsychological testing, measures from processing speed and psychomotor speed were used to differentiate fighters into cognitively impaired and non-impaired groups, as cognition cannot be seen as a singular entity, Dr. Mishra noted. All fighters underwent T1-weighted MRI and DTI.
The study revealed a set of seven imaging predictors, including regions of gray matter and white matter, which were associated with cognitive function in fighters. For instance, T1-weighted volumetric measurements of the left thalamus, a mass of gray matter in the middle of the brain that acts as a relay center connecting a multitude of brain regions, helped distinguish cognitively impaired and non-impaired fighters. Fractional anisotropy values, a measure of white matter integrity, along two different white matter tracts were also identified as possible predictors of cognitive impairment. The researchers concluded that this set of seven brain regions comprising of both gray and white matter may become imaging biomarkers of cognitive impairment in fighters.
“We found lower gray matter volume and thickness measures along with lower white matter tract integrity at baseline measurements that declined over time in those with ongoing trauma, and only by looking at both were we able to predict which fighters would be cognitively impaired,” Dr. Mishra said. “The combined observation of both gray and white matter as useful predictors of cognitive impairment is understandable because these two types of brain tissue work in tandem.”
The MRI approach using different modalities may have several applications, Dr. Mishra said. For one, it could be used to help predict later cognitive change in fighters. Another key potential application is to track change in clinical trials of novel therapeutics aimed at reducing the risk of cognitive impairment.
The approach also may have applications in studying the impact of other contact sports where head injuries often occur, such as football and hockey.
In the future, the researchers hope to determine the order in which brain regions are affected by repeated trauma.
“One of the key questions we’re trying to answer is, what’s affected first, the neurons in the gray matter or the fiber tracts in the white matter?” Dr. Mishra said. “We don’t have the answer yet, but it’s something we are working on.”
“Multimodal MR Imaging Signatures of Cognitive Impairment in Active Professional Fighters.” Collaborating with Dr. Mishra were Xiaowei Zhuang, M.S., Karthik Sreenivasan, M.S., Sarah J. Banks, Ph.D., Zhengshi Yang, M.S., Charles Bernick, M.D., M.P.H., and Dietmar Cordes, Ph.D.
Radiology is edited by Herbert Y. Kressel, M.D., Harvard Medical School, Boston, Mass., and owned and published by the Radiological Society of North America, Inc. (http://pubs.rsna.org/journal/radiology)
RSNA is an association of over 54,600 radiologists, radiation oncologists, medical physicists and related scientists promoting excellence in patient care and health care delivery through education, research and technologic innovation. The Society is based in Oak Brook, Ill. (RSNA.org)
For patient-friendly information on MRI of the brain, visit RadiologyInfo.org.
Images (.JPG and .TIF format)
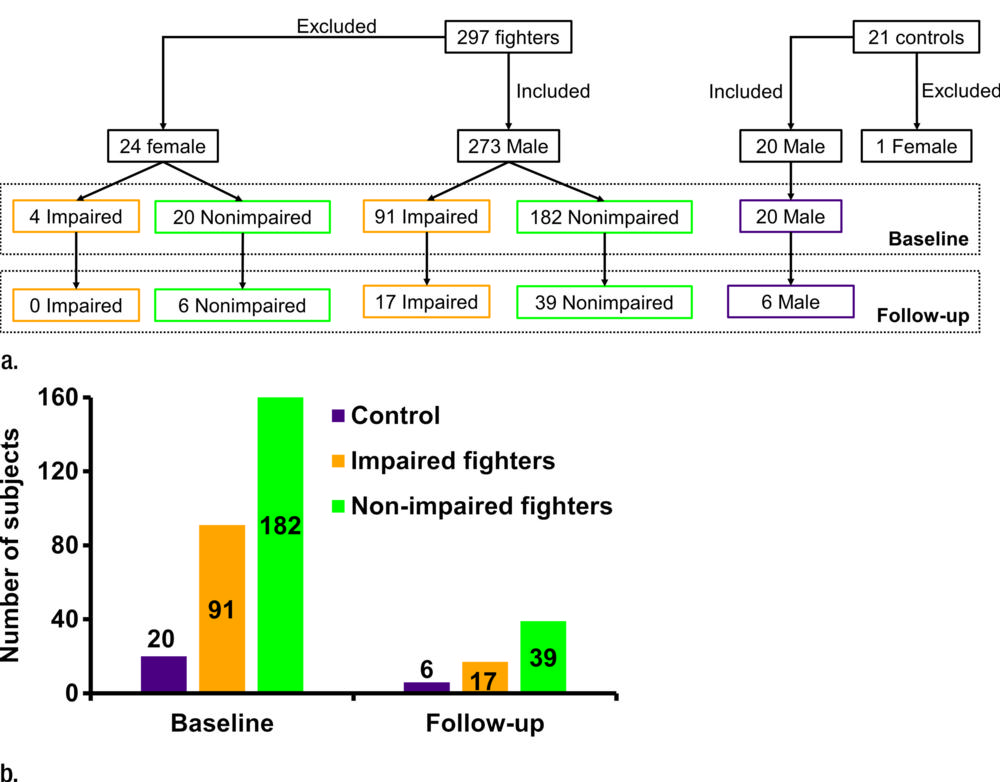
Figure 1. (a) Flowchart shows total number of subjects who participated in study and breakdown of these subjects into impaired fighters, nonimpaired fighters, and control subject groups. Breakdown of the subjects according to sex at baseline and follow-up for each group is also shown. Of note, only male fighters were included to design the classifier for separation of impaired and nonimpaired fighters. (b) Bar graph shows distribution of male cohort at baseline and follow-up and classification into impaired and nonimpaired fighter groups based on standardized clinical scores is shown. Numbers in bar graph represent total number of subjects in each group at baseline and follow-up.
High-res (TIF) version
(Right-click and Save As)
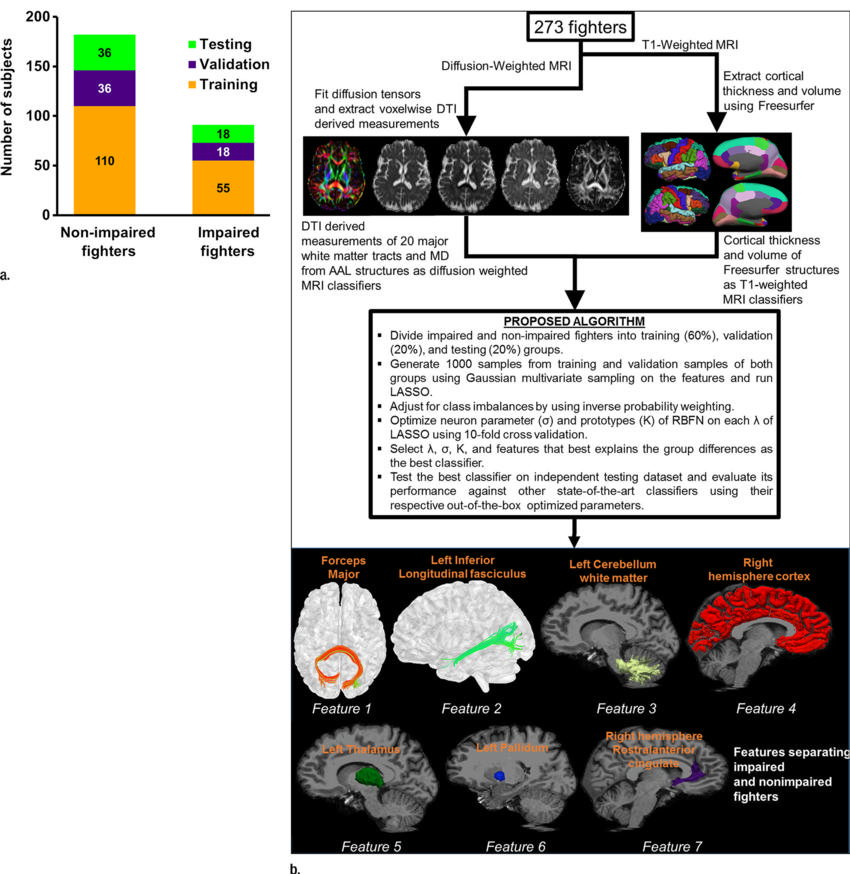
Figure 2. (a) Bar graph shows total impaired and nonimpaired fighters who were included for classification. Subjects in each fighter population were divided into training (60 percent; 110 of 182 nonimpaired and 55 of 91 impaired fighters), validation (20 percent; 36 of 182 nonimpaired and 18 of 91 impaired fighters), and testing (20 percent; 36 of 182 nonimpaired and 18 of 91 impaired fighters) sets. Training and validation sample set were shuffled 10 times to estimate best training parameters. Numbers represent actual number of subjects in each set. (b) Pipeline used to generate features from diffusion-weighted and T1-weighted MR imaging is shown. Brief description of classifier for which least absolute shrinkage and selection operator (LASSO) and radial basis functional networks (RBFNs) were used, and imaging features associated with cognition in our cohort of active professional fighters, overlaid on Montreal Neurological Institute 152 template, is also shown. AAL = anatomical atlas labeling, MD = mean diffusivity, DTI = diffusion-tensor imaging.
High-res (TIF) version
(Right-click and Save As)
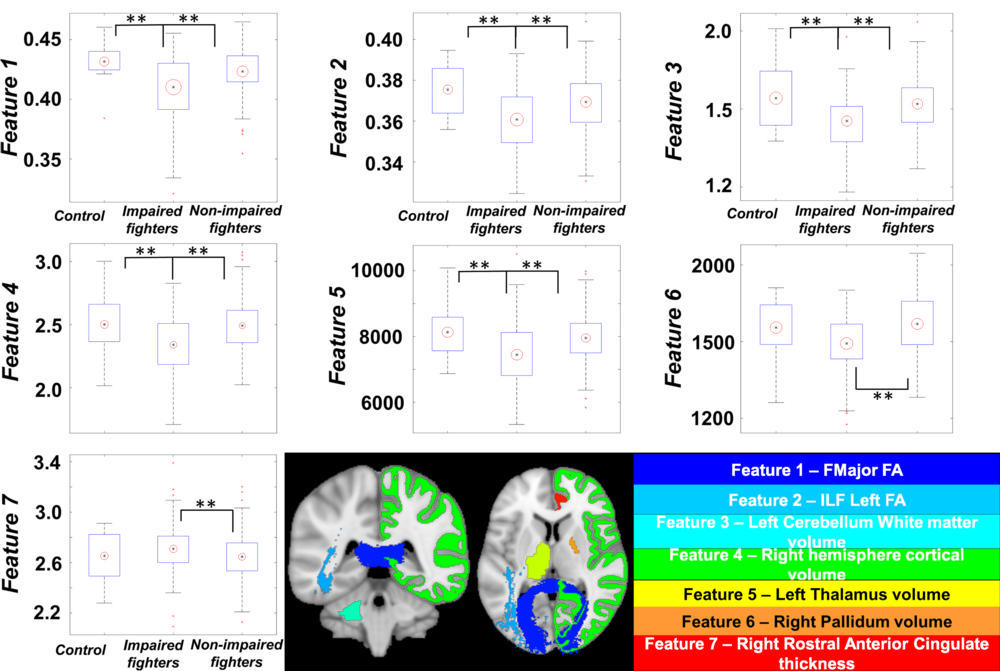
Figure 3. Boxplots of features identified by using our classifier is shown for every group. Black central dot represents mean, and radius of red circle represents standard deviation of each feature. All standard deviations were scaled to same number throughout groups to reflect between-group differences.
** = Between-group statistical differences for each feature over respective groups. Imaging biomarkers were overlaid on Montreal Neurological Institute 152 template brain and shown at bottom. Name of biomarker is color coordinated with overlaid colors on Montreal Neurological Institute 152 template. Data in boxplots for feature 3 are X 104, and data in the feature 4 boxplot are X 105. ** = corrected P < .05 indicates a significant difference.
High-res (TIF) version
(Right-click and Save As)

Figure 4. Scatterplots show average values for each feature that were extracted for every subject and plotted against processing speed, psychomotor speed, and number of professional fights. Impaired fighters are represented by green circles, nonimpaired fighters are represented by blue cross, and control subjects are represented by red squares. Regression lines are shown in the same colors as those in the scatterplot for the group. Statistically significant regression lines (correlation P < .05) are shown as solid line for every feature. Dashed regression lines were nonsignificant but are shown for those features that have a significant differential association among groups.
High-res (TIF) version
(Right-click and Save As)